How Often Do Brands Post on Instagram? Posting Frequency Benchmarks (2026)
How often do brands post on Instagram? Posting frequency benchmarks from 2026 studies, by industry and account size, with sources, plus how to measure a competitor.
 Andrea Marino10 min read
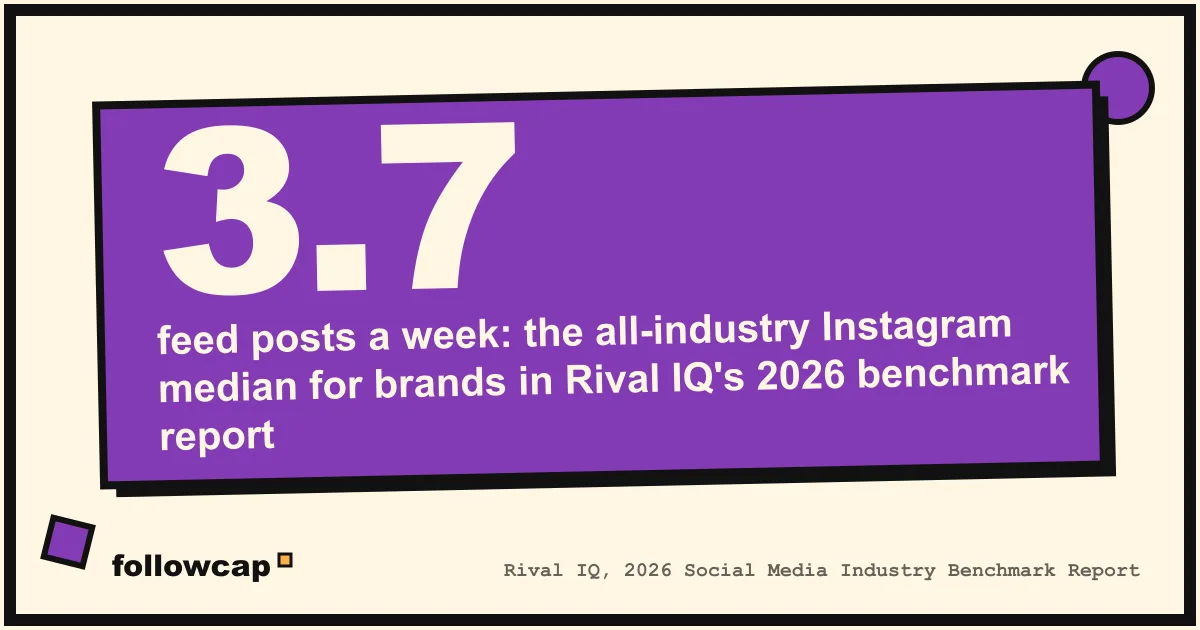
How often do brands post on Instagram? The 2026 benchmark reports put the typical brand at roughly 4 to 5 feed posts a week: a median of 3.7 in Rival IQ’s report, an average of 5 in Socialinsider’s. Industry changes everything, sports and media accounts post around 30 times a week, and the frequency that earns the best engagement per post is lower than the average in most studies.
Quick answer: the brand median is 3.7 feed posts a week (Rival IQ, 2026), the brand average is 5 (Socialinsider, 2026 report on 2025 data), small accounts post about 2 a week and mid-size accounts about 5 (Later, 2023 data), and the highest engagement rate per post sits at 2 to 3 feed posts a week across 3,000 brands (Dash Social, 2026). Measure your own niche before you copy any of these numbers.
How often do brands post on Instagram? The headline numbers
Rival IQ’s 2026 Social Media Industry Benchmark Report, published in March 2026, found that the median posting frequency on Instagram “settled at 3.69 posts per week”, a decline for the second year running. The sample is 150 companies picked at random from each of 18 industries in a database of more than 200,000 companies, and every figure is a median. The all-industry median engagement rate per post was 0.30 percent, down from 0.36.
Socialinsider’s 2026 social media benchmarks use a different sample: 75.6 million organic Instagram posts from brands with 1,000 to 1 million followers, covering 2025. They report an average of 5 posts a week on Instagram, or 20 a month, unchanged from 2024.
Dash Social’s 2026 Instagram posting frequency study, published in August 2026, analysed about 3.3 million posts from more than 3,000 brands between July 2025 and June 2026. Brand averages by industry sit mostly between 4 and 8 feed posts a week, and 2 to 3 feed posts a week produced the highest engagement rate.
Later’s posting frequency analysis, updated in March 2025, used more than 19 million feed posts and 32,000 Stories published through Later between January and October 2023, split by account size: nano accounts (under 10,000 followers) averaged 2 feed posts a week, micro (10,000 to 100,000) 3, mid (100,000 to 500,000) 5.
A median of 3.7 and an average of 5 both describe brands because Socialinsider’s average includes accounts up to 1 million followers, and bigger accounts post more. The honest answer to how often do brands post on Instagram is 3 to 5 feed posts a week for most brands, 2 for small accounts, and far more for publishers and sports teams.
Posting frequency by industry
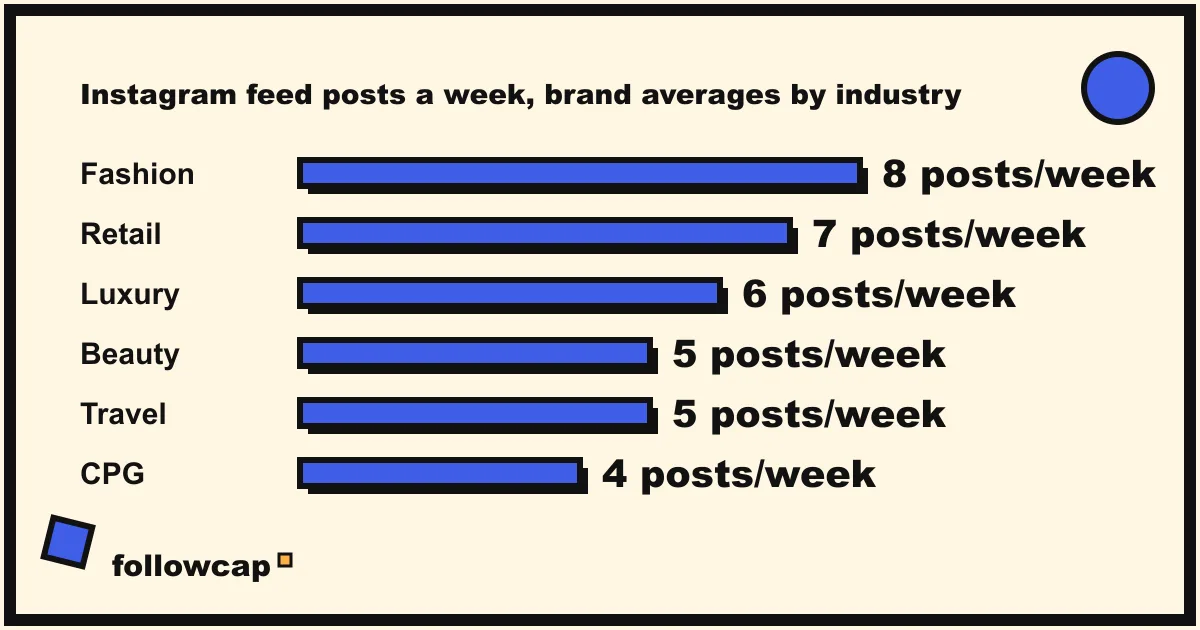
Dash Social is the only study with a per-industry table separating feed posts, Stories and Reels. Brand averages, July 2025 to June 2026, posts per week:
| Industry | Feed posts | Stories | Reels |
|---|---|---|---|
| Sports | 32 | 30 | 13 |
| Media and entertainment | 32 | 15 | 18 |
| Publishing | 26 | 17 | 10 |
| Fashion | 8 | 23 | 3 |
| Retail | 7 | 21 | 4 |
| Luxury | 6 | 20 | 2 |
| Beauty | 5 | 16 | 3 |
| Food and beverage | 5 | 15 | 3 |
| Wellness | 5 | 17 | 2 |
| Travel | 5 | 11 | 2 |
| Home | 5 | 13 | 2 |
| Baby and children | 5 | 13 | 2 |
| Real estate | 5 | 1 | 2 |
| CPG | 4 | 13 | 2 |
Publishers, media and sports accounts post 26 to 32 times a week because publishing is their product, and no consumer brand should benchmark against them. Everyone else sits between 4 and 8 feed posts a week, fashion and retail at the top. Rival IQ’s 2026 report gives only a ranking, with Media, Sports, Beauty and Retail the most active and Energy and Pharma the least, and it matches this table.
Hootsuite’s 2026 social media benchmarks, published in April 2026, give Instagram averages for a few industries only: technology 12.1 posts a week, dining, hospitality and tourism 11.9, marketing agencies 10.3. They sit well above the other studies and Hootsuite does not describe its sample or period, so treat them as a reference point. If your niche is in no table, count it yourself (below); the general method is in social media benchmarking.
Posting frequency by account size
Size predicts cadence better than industry for anyone under 500,000 followers. Later’s 2023 split is the cleanest published: 2 feed posts a week for nano accounts, 3 for micro, 5 for mid, and Stories widen the gap, from 3 a week for nano to 15 for mid-size accounts.
Metricool’s 2026 Instagram study, published in June 2026 from 24.4 million posts across 375,118 accounts, comparing January and February of 2025 with the same months of 2026, asked the opposite question: which cadence earned the most interactions per post at each size. Small accounts (2,000 to 10,000 followers) peaked at 7 to 14 posts a week, medium accounts (10,000 to 100,000) at 14 to 30, while big accounts (100,000 to 1 million) did better per post when they posted less, and accounts over 1 million posting less than once a week got nearly 6 times more interactions per post than those posting daily. Later measured what accounts do, Metricool where interactions per post peaked, and for small accounts the peak is three to seven times the actual average.
Feed posts, Reels and Stories: three cadences
Feed posts are the slowest, 2 to 8 a week for consumer brands. Reels are a subset: Dash Social found 1 to 3 Reels a week produced the highest engagement rate in a subset of about 700,000 Reels, and its table shows 2 to 4 Reels a week for most consumer brands against 10 to 18 for publishers and media. Stories are an order of magnitude more frequent: 11 to 23 a week for most consumer industries, 30 for sports, and brands posting 30 or more Stories a week, about 4 to 5 a day, had the highest average completion rate in Dash Social’s data.
Does posting more often raise engagement?
Per post, no; in total, usually yes. Dash Social’s peak is 2 to 3 feed posts a week. Hootsuite reports the frequency with the highest Instagram engagement rate per industry: 2 posts a week at 4.04 percent overall, the same 2 for healthcare and marketing agencies, while education (28 posts a week, 4.52 percent), nonprofits (25, 4.95 percent) and retail (25, 3.66 percent) peaked at high volumes. Its summary is that posting more “isn’t always better”.
Engagement rate is a ratio, so it falls as volume rises even when total interactions grow. Rival IQ’s report shows both at once: brands posted less in 2025 and the median engagement rate still fell 17 percent. Buffer’s 2025 study, summarised in how often should you post on Instagram, found reach per post and follower growth rising with frequency, with diminishing returns at each step: each extra post earns a little less, but still earns, until quality drops. What the rate looks like at each account size is in Instagram engagement rate benchmarks.
Why the benchmarks disagree
Check four things on a study’s own page before its figure goes in a report. Median or average: Rival IQ publishes medians, Socialinsider and Dash Social averages, which publishers pull up. The sample: random companies per industry, brands of 1,000 to 1 million followers, or a tool’s own customers (Later, Metricool). The period: Later’s 2026 guide uses 2023 data, Socialinsider’s 2026 benchmarks describe 2025. And what counts as a post: Later counts Reels inside feed posts, Dash Social separates them, nobody counts Stories. The cadence of the accounts you compete with is in none of them.
How to measure a competitor’s posting frequency by hand
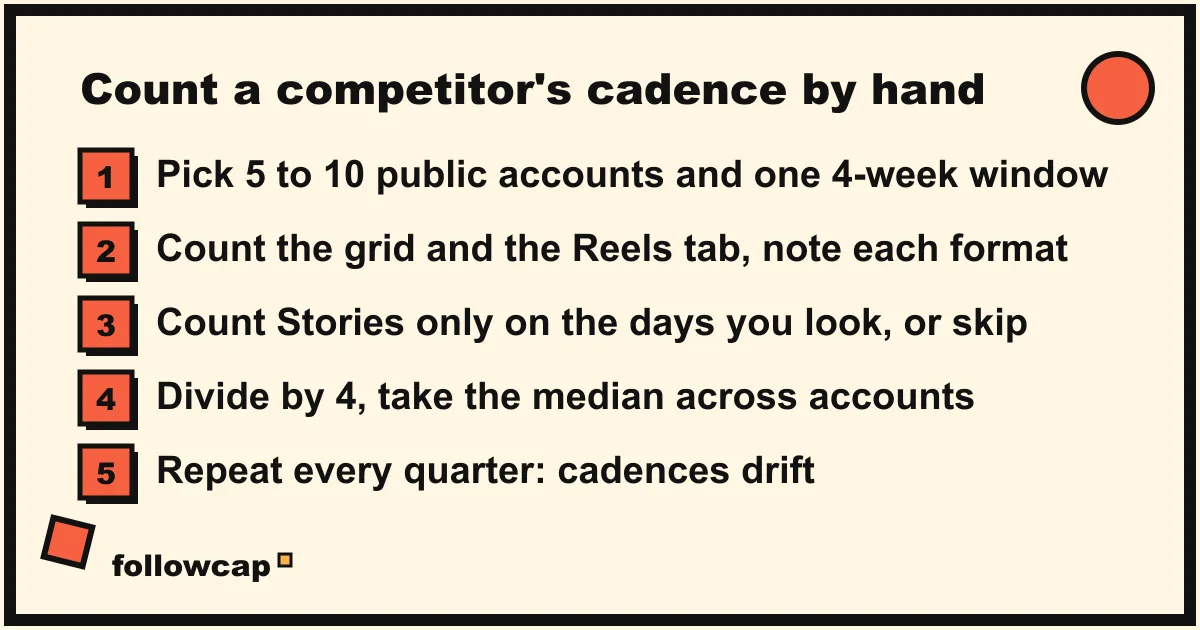
Public profiles show every feed post with its date, so a competitor’s cadence is a counting exercise. Four weeks is the minimum; one week catches a campaign or a holiday.
- Pick the accounts and the window. Five to ten public business or creator accounts in your niche, close to your size, and one fixed four-week window for all of them.
- Count the grid. Scroll to the first post inside the window and count forward, noting the format (image, carousel, Reel), then add any Reels in the Reels tab you have not counted. Check the dates of pinned posts.
- Count Stories separately, if at all. Stories vanish after 24 hours, so count them on the days you look, at the same time daily for a week, or leave them out and say so.
- Compute and compare. Divide by 4 for posts per week, take the median across accounts, not the average, note the format split, and repeat every quarter, because cadences drift.
A sheet with one row per post (date, account, format, likes, comments, link) does the counting and adds the engagement side, where competitor content analysis picks up. Our estimate: one account by hand takes about 15 minutes a week, so ten cost about 2 hours 30.
Followcap is our product, so read this as the maker’s description. You type the usernames of public Instagram creator or business accounts, no Instagram login or password needed, and every Sunday you get one email: a 30-second summary, the 3 posts not to miss, then the best 3 posts of each account with a short recap, the day and the link, and how many more posts the account published if it posted more than 3 times, which is the weekly frequency you were counting. Three accounts are free, no card. Premium (€9 a month, 10 accounts) adds weekly numbers per account (posts, likes, comments, best post, follower growth) and an archive page that keeps every post of every week, searchable by account. The limits: weekly, not real time; public creator and business accounts only; posts, likes, comments and follower counts only, never reach, views, saves, Stories or audience data.
How to pick your own cadence from the data
The benchmarks give a range; your niche count gives a point inside it.
Start at your niche median, not the global one. If the ten accounts you counted post a median of 4 feed posts a week, 4 is your baseline, whatever Rival IQ or Socialinsider say.
Test one step up for a quarter. The per-post engagement peak at 2 to 3 posts a week is a ceiling on efficiency, not on results. Move from 3 to 5 a week for twelve weeks, keep the format mix fixed, and compare total interactions and follower growth with the previous quarter, not the engagement rate, which falls by construction.
Let Stories carry the volume. Every industry table puts Stories at three to four times the feed cadence.
The real constraint is a schedule the team can keep for a year. The advice side, including what Instagram has said about frequency, is in how often you should post; this article is the numbers.
FAQ
How many times a week do brands post on Instagram?
A median of 3.7 times a week in Rival IQ’s 2026 report, an average of 5 for brands with 1,000 to 1 million followers in Socialinsider’s 2026 benchmarks, and 4 to 8 a week for consumer industries in Dash Social’s 2026 study; publishers, media and sports accounts post 26 to 32.
Is posting once a day on Instagram too much for a brand?
Seven feed posts a week is above the brand median of 3.7 and at the top of the consumer band (fashion 8, retail 7). It is normal for retail and fashion, high elsewhere, and well above the 2 to 3 posts a week where per-post engagement rate peaks.
How often do brands post Instagram Stories?
Far more often than feed posts: 11 to 23 a week for most consumer industries and 30 for sports in Dash Social’s 2026 table, 3 to 15 a week by account size in Later’s 2023 data.
Does posting more on Instagram lower engagement rate?
Per post, usually yes: Dash Social and Hootsuite both found the highest rate at 2 to 3 feed posts a week for most industries. Total interactions and reach still tend to rise, so judge a cadence change on totals and follower growth.
Related reading
- Instagram Follower Growth Rate: Formula, Benchmarks and How to Track It
- The Best Instagram Analytics Tools in 2026 (Yours and Others’)
- 8 Best Instagram Monitoring Tools in 2026 (Creators and Brands)
The bottom line
How often do brands post on Instagram? About 3.7 feed posts a week at the median, 5 on average, 2 for small accounts, 30 for publishers and sports teams, with Stories three to four times more frequent than the feed, according to the studies above. Per-post engagement peaks at 2 to 3 posts a week in most industries; totals keep rising past it. Use the benchmarks for the range, count your own niche for the point, by hand over four weeks or with a weekly recap such as Followcap, and change cadence one step at a time, judged on totals over a quarter.