Instagram Engagement Rate: Formula, Benchmarks, How to Check
Instagram engagement rate explained: the formula, how to calculate it for any public account in 2 minutes, what counts as good in 2026, and what it hides.
 Andrea Marino9 min read
Instagram engagement rate is the one number that tells you whether an audience actually reacts to an account, or just follows it. You can calculate it for any public account with a calculator and two minutes, and you do not need the owner’s permission or any tool. This guide gives you the formulas, a by-hand method, honest benchmark ranges, and the things the number cannot tell you.
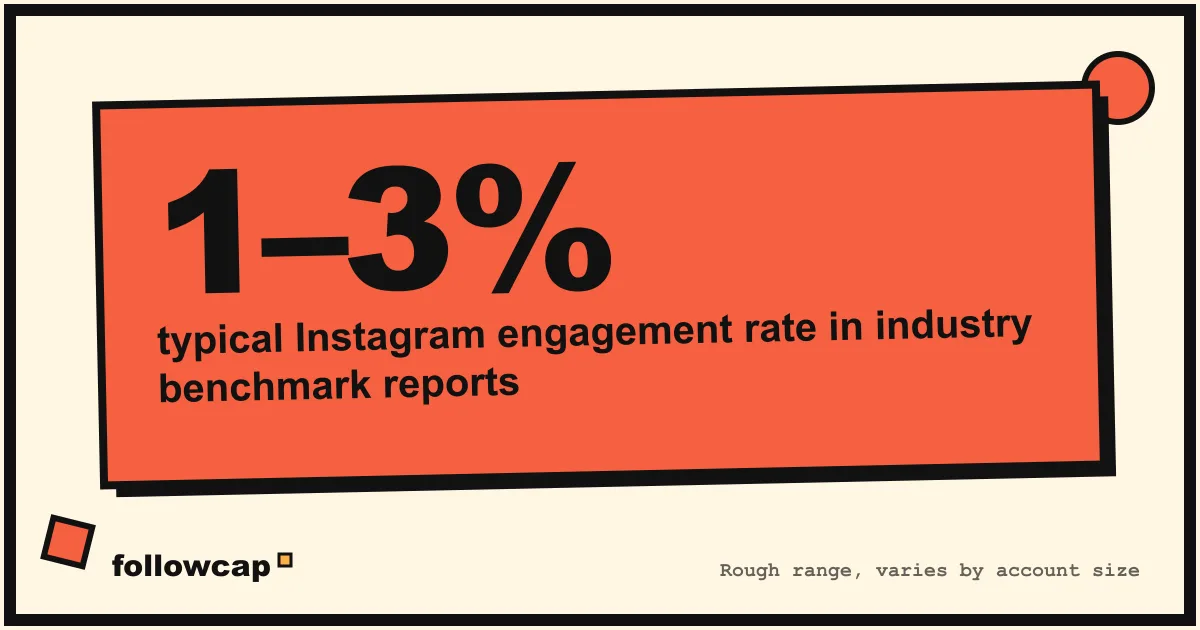
Quick answer: Engagement rate is (likes + comments) ÷ followers × 100, averaged over an account’s recent posts. Industry benchmark reports put typical Instagram rates roughly between 1 and 3%, higher for small accounts and lower for very large ones. To check any public account, average likes and comments on its last 10 to 12 posts and divide by followers.
What is engagement rate on Instagram?
Engagement rate measures interactions relative to audience size. Follower count tells you how many people clicked follow at some point. Engagement rate tells you how many of them still react when the account posts.
That makes it a better signal than followers for most decisions: which creators are worth learning from, which accounts a brand should partner with, whether a competitor’s growth is real or bought. An account with 20,000 followers and a 4% rate has a more alive audience than one with 500,000 followers and 0.3%.
Two caveats before the math: there is more than one formula, and the public version of the number is built only from what Instagram shows on a public post, which leaves out a lot. Both matter when you compare accounts.
The Instagram engagement rate formula (three versions)
By followers (the standard one)
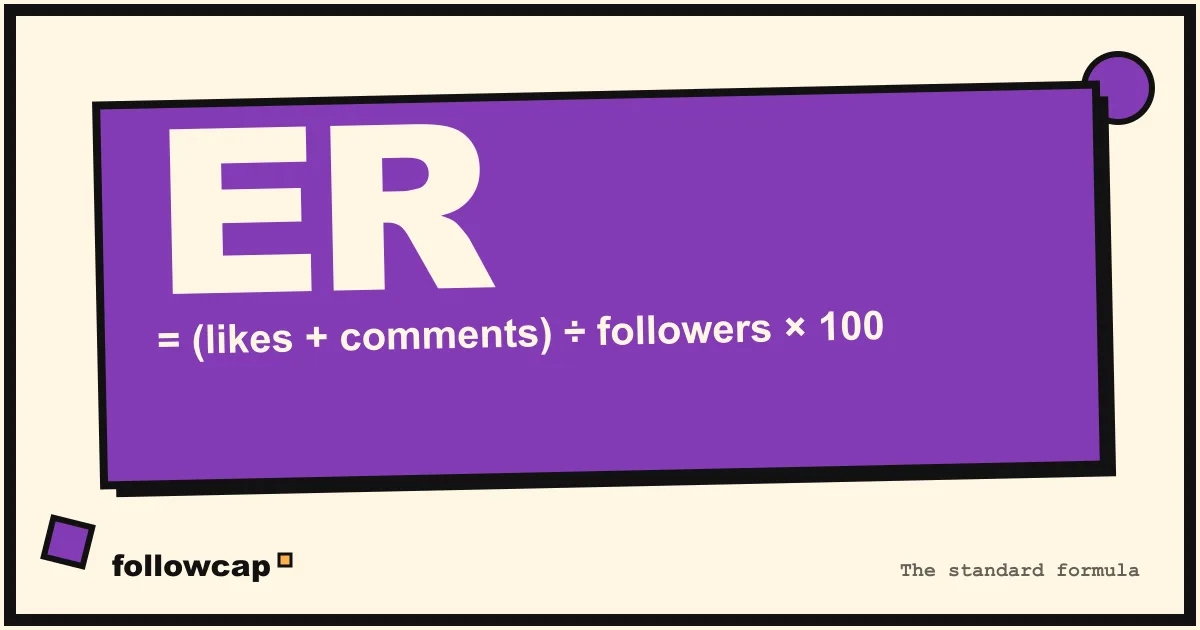
(likes + comments) ÷ followers × 100
This is the formula most benchmark reports, agencies and lookup tools use, because every input is public. Use it to compare accounts you do not own, or to check a number against industry ranges. Its weakness: it assumes all followers saw the post, which is never true on a ranked feed.
By reach (the accurate one, own account only)
(likes + comments + saves + shares) ÷ reach × 100
Reach is the number of unique accounts that actually saw the post. Dividing by reach tells you how the people who saw it reacted, which is the question you usually care about. The catch: reach, saves and shares are only visible to the account owner in Instagram Insights. You cannot compute this for anyone else’s account, and any tool that claims to is estimating.
By views (for reels)
(likes + comments) ÷ views × 100
Reels show a public view count, so you can divide by views instead of followers. Reels travel far beyond an account’s followers; a reel with 2 million views on a 50,000-follower account would show an absurd follower-based rate. The view-based rate is much smaller, so never compare it with a follower-based one.
Which formula should you use?
- Comparing public accounts: by followers, and by views for reels, kept separate.
- Judging your own content: by reach, from Insights.
- Reading a benchmark report: check which formula they used before you compare your number to theirs. Most use the follower-based one.
How to calculate the engagement rate of any public Instagram account
You need the profile, a calculator, and about two minutes. Here is the method we use when we check an account by hand.
- Open the public profile and note the follower count. Round it; precision beyond three digits does not change the result.
- Pick the last 10 to 12 posts, skipping anything from the last 48 hours, because recent posts are still collecting likes and comments.
- For each post, add likes and comments. If the account hides like counts (Instagram lets owners do that), you cannot compute a like-based rate for it; use comments only and say so, or skip the account.
- Average those totals across the posts you counted.
- Divide by followers and multiply by 100.
Worked example: an account with 10,000 followers. Its last 12 posts average 180 likes and 20 comments, so 200 interactions per post. 200 ÷ 10,000 × 100 = 2.0%. That sits inside the typical range from benchmark reports.
For reels, do the same but write down views as well, and compute a second, view-based rate. Keep the two columns apart.
Count feed posts and reels, not stories, which are gone after 24 hours and show no public numbers. When you check several accounts, use the same number of posts for each.
What is a good engagement rate on Instagram?
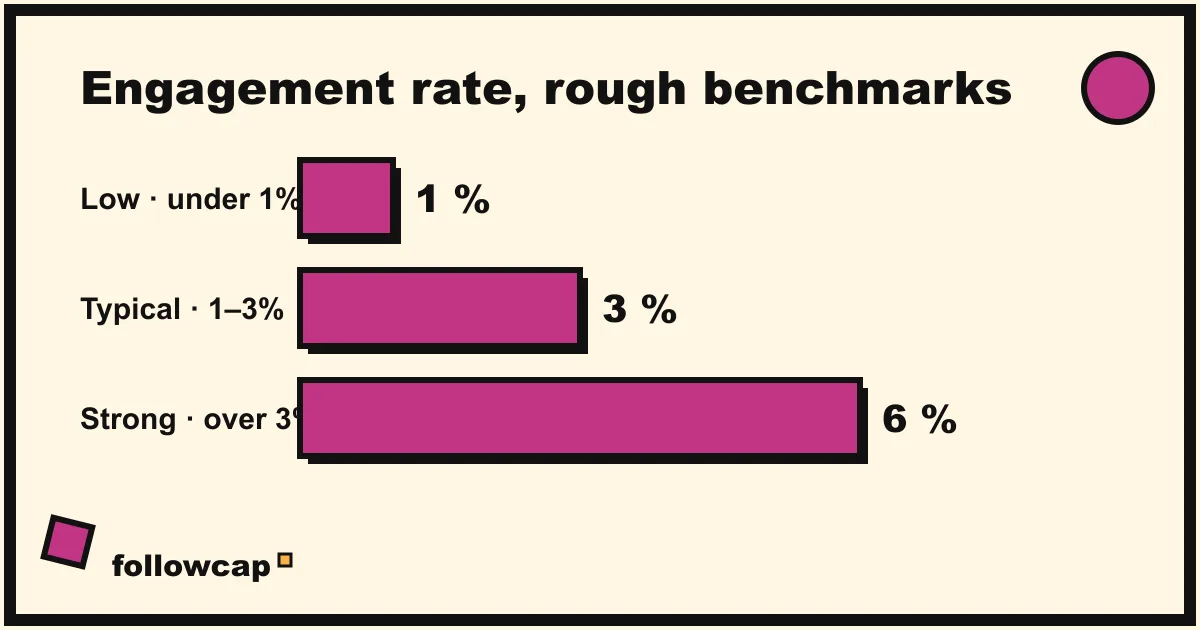
Industry benchmark reports, which are published every year by several analytics companies, consistently place average Instagram engagement rates in the low single digits. As a rough reading, using the follower-based formula:
- Under 1%: low. Common for very large accounts, inactive audiences, or accounts that grew through giveaways and follow-for-follow.
- 1 to 3%: typical. Most active accounts land here.
- Over 3%: strong. Usual for small, focused accounts and for creators with a real community.
Treat these as ranges, not grades, for three reasons.
Size matters. Small accounts almost always have higher rates, because a few hundred engaged followers are a larger share of 5,000 than of 500,000. Compare an account to others of similar size. Our guide to Instagram competitor analysis covers why comparing to accounts ten times your size is a common mistake.
Niche matters. A meme account and a tax advisor play different games. Build your own benchmark from 5 to 10 accounts in the same space.
Promoted views inflate numbers. If an account pays to boost posts or reels, views and sometimes likes go up without the audience changing. You cannot see from outside which posts were promoted, so a sudden spike on one post is a reason to look closer, not to celebrate.
What engagement rate hides
The public engagement rate is a proxy, and it is worth being clear about what it leaves out.
- Saves and shares are private. On your own account you see them in Insights. On other accounts you do not, and for educational content they are often the most meaningful interaction.
- Reach is private. The follower-based rate divides by people who may never have seen the post. Instagram’s feed is ranked, and the company has said it personalizes what each person sees, so a post reaching 20% of followers and one reaching 60% get the same denominator.
- Watch time and demographics are private. No public number tells you whether people watched a reel to the end, or who they are.
- Comments can be padded. A creator replying to every comment doubles the comment count. Giveaway posts (“tag two friends”) produce huge rates for a day.
- Hidden likes break the formula. When likes are hidden, lookup tools either skip the post or estimate. Ask which.
This is why the number works best as a comparison, over time and between similar accounts, not as a verdict. A rate that drops from 3% to 1.5% over two months is a story. A single 1.5% reading is just a number.
How to track engagement rate weekly for the accounts you follow
A single calculation tells you where an account is. A weekly series tells you where it is going, which is more useful whether you are a brand watching competitors or a creator learning from the people ahead of you.
The spreadsheet way
One row per account per week: date, followers, posts this week, average likes, average comments, average reel views, follower-based rate, view-based rate. Thirty minutes on Sunday covers 5 to 10 accounts. It works, and we did it this way for months. The cost is the manual counting, and having to open Instagram to do it, which for most of us turns a 30-minute task into an hour of scrolling. If that is your pattern too, our notes on how to stop doomscrolling apply to the research itself.
The automated way
This is part of why we built Followcap. It is our product, so weigh this accordingly. You type the usernames of public creator or business accounts, with no Instagram login, and every Sunday you get one email with their week: a short summary, the top 3 posts, a recap of the best posts from each account with their links, and a “what you can apply this week” note. On the Premium plan (up to 10 accounts) the email also carries the weekly numbers for each account: posts, likes, comments, best post and follower growth, with a personal archive page so you can look back. The limits are real: it is weekly, not real-time; it covers public accounts only; and the engagement rate is the public one, built from likes and comments, not from views, reach or saves, because nobody outside the account can see those. It is paid after a 7-day free trial, so it only makes sense if these numbers feed real decisions. For a broader look at the alternatives, see our comparison of Instagram monitoring tools.
Whichever way you track it, look for three things each week: a rate moving in one direction for three or more weeks, a post at 2 to 3 times the account’s average (read it, that is where the lesson is), and follower growth outpacing engagement growth, which usually means the new followers are not the right ones.
Common mistakes when comparing engagement rates
- Mixing formulas. A 1.2% view-based reel rate and a 1.2% follower-based post rate are not the same thing.
- Counting too few posts. Three posts is a mood, twelve is a pattern.
- Comparing across sizes and niches. A 5,000-follower bakery and a 2-million-follower fashion brand should never share a chart.
- Treating the rate as a quality score. It measures reaction, not value. Some of the most useful accounts we follow have modest rates because people save their posts instead of liking them, and saves are invisible from outside.
FAQ
How do I check the engagement rate of an Instagram account that is not mine?
Average the likes and comments on its last 10 to 12 public posts, divide by its follower count and multiply by 100. For reels, divide by views instead. You cannot use reach, saves or shares for an account you do not own, because Instagram shows those only to the owner.
What is a good engagement rate on Instagram in 2026?
Industry benchmark reports place typical rates roughly between 1 and 3% using the follower-based formula. Small accounts often sit above that and very large accounts below it. Compare against accounts of similar size in the same niche rather than against a global average.
Is engagement rate more important than followers?
For most decisions, yes. Followers measure past interest; engagement rate measures current attention. The exception is pure reach goals, where size still matters.
Why is my reel engagement rate so low?
Because you are probably dividing by views. Reels reach far beyond your followers, so the view-based rate is naturally much smaller than a follower-based rate on a photo post. Compare reels with reels and posts with posts.
Related reading
- Best Time to Post on Instagram in 2026 (and How to Find Yours)
- How Often Should You Post on Instagram? What the Accounts in Your Niche Actually Do
- How to Track Influencers and Creators for Your Brand Without an Agency
The bottom line
Instagram engagement rate is likes plus comments, divided by followers, times 100, averaged over an account’s last 10 to 12 posts, with a separate view-based number for reels. Benchmark reports put typical rates around 1 to 3%, higher for small accounts and lower for large ones, so compare like with like. Remember what the public number hides: reach, saves and shares are only visible to the owner. If you want the public rate for the accounts you follow delivered weekly, with their posts, start a free Followcap trial on the Premium plan; it is our product, weekly rather than real-time, and public accounts only.