Instagram Competitor Analysis: A 30-Minute Weekly Routine
A practical Instagram competitor analysis routine: pick 5 to 10 accounts, track six public numbers every week, read their top posts and leave with three ideas.
 Andrea Marino9 min read
Most Instagram competitor analysis advice either tells you to “study the competition” with no method, or sells you a dashboard with forty metrics you will never read. This guide is the middle path: a 30-minute weekly routine, six numbers you can actually see on any public account, and a spreadsheet simple enough to keep. It is built from what we do ourselves every week.
Quick answer: pick 5 to 10 public accounts in your niche. Once a week, record six public numbers for each: posts per week, format mix, top post by views, average likes and comments, follower growth, and outliers. Then read their three best posts and write down three ideas for your own content. Thirty minutes, same day every week.
What can you see on a competitor’s Instagram account?
You do not have access to a competitor’s Insights, and no tool, paid or free, can give you numbers Instagram does not make public. Here is the split as of 2026.
| Public, visible to anyone | Private, only the account owner sees it |
|---|---|
| Follower count and following count | Reach and impressions |
| Number of posts | Saves and shares |
| Likes on each post, when the account shows them | Watch time and average view duration |
| Comments on each post, and their content | Audience demographics (age, location, gender) |
| Views on reels, captions, hashtags, posting times | Story views, profile visits, website clicks |
So your analysis is built on likes, comments, views and follower counts. Saves and shares often matter most for how a post travels, and you will never see them on someone else’s account. Some accounts also hide like counts; for those, comments and reel views are your only engagement signals.
Engagement rate is the one derived number worth computing: likes plus comments, divided by followers, times 100. Industry benchmark reports put typical Instagram engagement rates in the low single digits, roughly 1 to 3 percent, higher for small accounts and lower for very large ones. For the full method, including the version that uses views for reels, see how to see the engagement rate of any Instagram account.
Which six numbers should you track every week?
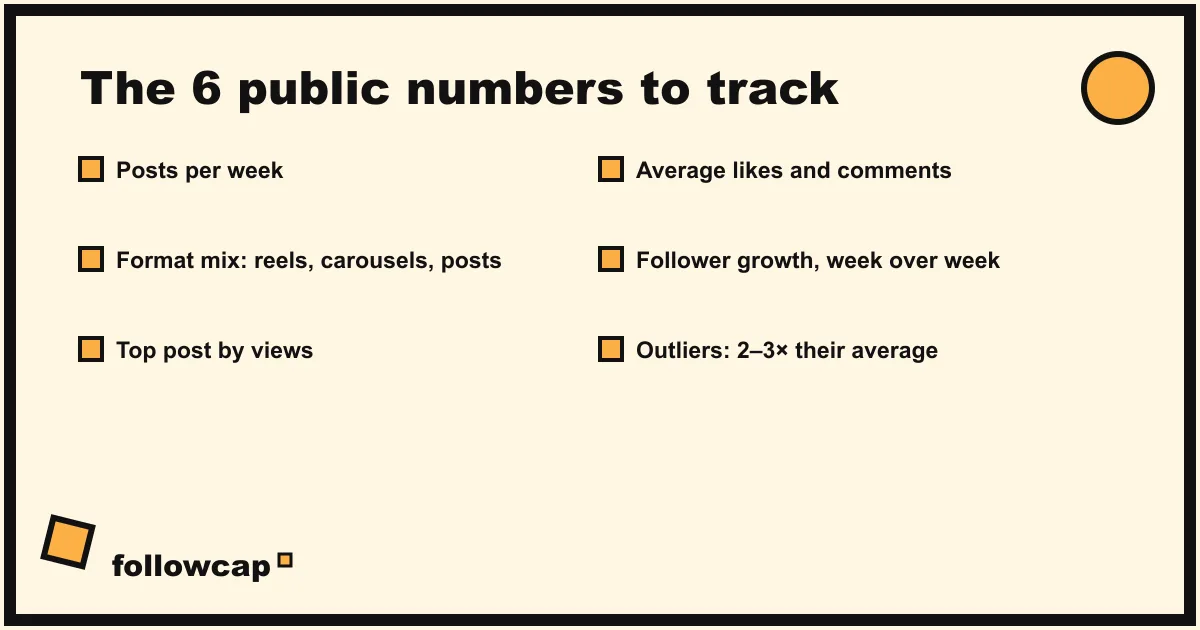
You could track thirty things. Six is enough to see what a competitor is doing and whether it is working, and few enough that you will still be doing it in three months.
- Posts per week. Count everything published in the last seven days: single images, carousels, reels. This is their effort level. A sudden jump usually means a campaign; a drop often means burnout or a pivot.
- Format mix. Of those posts, how many were reels, carousels and single images? Write it as three numbers, for example 4 / 2 / 1. Over a month you see what they bet on.
- Top post by views. The post or reel with the most views this week, with its link. This is the one you study in the reading block. For accounts that only post images, use likes instead.
- Average likes and comments. Add up likes across this week’s posts and divide by the number of posts; do the same for comments. Skip likes for accounts that hide them.
- Follower growth week over week. Record the follower count every week and subtract last week’s. Growth is the output of everything else, and far more useful than the total.
- Outliers. Any post at two to three times the account’s average likes, comments or views. Outliers are where the learning is: something in the hook, the format or the topic broke through.
How to set up a competitor analysis spreadsheet
Any spreadsheet with two tabs does the job, and building it yourself means you understand every column.
Tab 1: Weekly log. One row per account per week. Columns: date, account, followers, follower change, posts this week, reels, carousels, images, average likes, average comments, top post link, top post views, outlier (yes or no, with the link), one-line note. After three months you have a hundred rows you can sort and filter.
Tab 2: Ideas. One row per idea. Columns: date, the idea in one sentence, the competitor post that inspired it, format, status (not started, drafted, posted), and your own result once it is live. This tab is the real product of the routine.
Two rules keep the sheet useful:
- Record the same day each week. Numbers drift during the week as posts collect likes. If you log every Monday, each row covers the same seven days and the comparisons hold.
- Keep it to 5 to 10 accounts. Fewer and you are just watching one rival. More and the numbers block takes the whole half hour.
The 30-minute Instagram competitor analysis routine
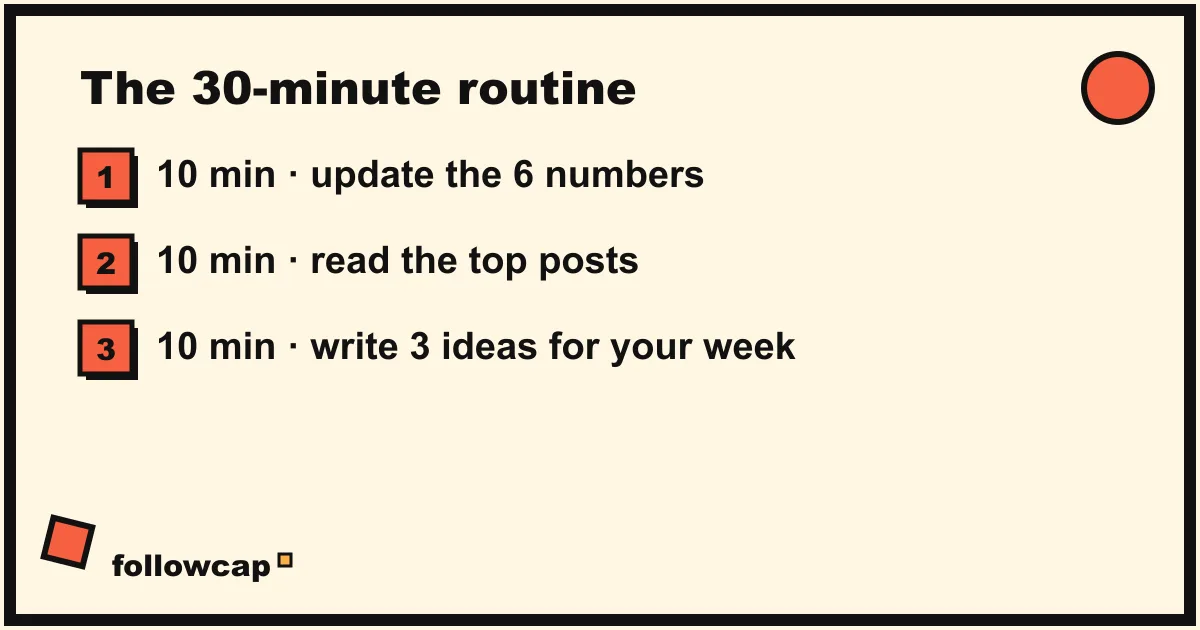
Put it in the calendar as one block, same day and time every week. In our own routine it is Monday morning, so the ideas feed straight into that week’s content. The block structure is the one we use for any focused work, described in time management techniques.
Minutes 0 to 10: the numbers
Open the log tab. For each account, open the profile, write down the follower count, count the week’s posts and their formats, note likes and comments for each post, and find the top post. With eight accounts this is a little over a minute each, which is tight. If this block keeps running over, drop two accounts or use a tool that collects the numbers for you, covered below.
Minutes 10 to 20: the reading
Close the spreadsheet. Open the top post from each account and watch or read it properly, including the first ten comments. Ask three questions: what was the hook in the first two seconds or the first line, what format carried it, and what did people say in the comments that the post did not say? Write one line per post in the note column, and one for each outlier. An outlier is not a trend until you have seen it twice.
Minutes 20 to 30: the ideas
Switch to the ideas tab. Write three ideas for your own account, each one sentence, each tied to a specific post you just read. The rule is “inspired by, not copied from”: same underlying question or format, your own angle, your own experience. Pick one for this week’s content plan, then close everything. The routine ends at thirty minutes whether or not you feel done; the weekly cadence does the work that a single long session cannot, the same principle behind most of the habits in how to be more productive.
Do you need a tool, or can you do it by hand?
By hand is where you should start. The first month of manual logging teaches you what the numbers mean, and it costs nothing. The problems appear later: the numbers block eats the half hour, or you skip a week and the data gets a hole.
A weekly recap with analytics is the next step up, and here we have to be transparent: Followcap is our product. Every plan sends one Sunday email with the best posts from the public accounts you choose, with a short recap and the link for each, which covers the reading block without opening the app. Three accounts are free. Premium (€9 a month, up to 10 accounts) adds a weekly line of numbers per account that maps to the metrics above: posts, likes, comments, best post and follower growth, plus a personal archive page. Business Pro (€29 a month, up to 50 accounts, 3 team users) adds a “you vs your niche” comparison, weekly content ideas, a hook library, a brand radar and a monthly PDF report. The limits: it is weekly, not a live dashboard, so you see last week’s numbers on Sunday rather than today’s; it covers public creator and business accounts only; and it is paid after the 7-day free trial, with a 30-day money-back after the first charge. Like every tool, it cannot show a competitor’s reach, saves or audience. If the numbers block is the part you want to automate, you can start a trial with your list.
For a wider comparison that includes Instagram Insights, Meta Business Suite and the social media management suites, see the best Instagram monitoring tools. Whatever you choose, the reading and ideas blocks stay yours.
Which mistakes make competitor analysis useless?
We have made most of these ourselves.
- Copying instead of learning. Reposting a competitor’s idea with a new caption gets you a weaker version of their result and teaches you nothing. Take the question they answered or the format they used, then bring your own experience.
- Obsessing over follower count. It is the most visible number and the least useful. A smaller account at 4 percent engagement is often doing better work than a large one at 0.5 percent.
- Comparing yourself to accounts ten times your size. Their numbers reflect their distribution, not their craft. Keep most of your list within a few multiples of your own size.
- Trusting outliers you cannot explain. A reel with views far above the account’s normal may have been promoted as an ad, and you cannot tell from outside. Do not build a strategy on it until the pattern repeats.
- Doing it once. One session gives you a snapshot. Eight sessions give you trends, and trends are the only thing worth acting on.
FAQ
How many competitors should I track on Instagram?
Five to ten. Fewer than five and you are watching rivals rather than analyzing a niche; more than ten and the weekly numbers take longer than the thinking. Mix direct competitors near your size with two or three accounts slightly ahead of you, and at most one large account for format ideas.
Can competitors see that I am analyzing their account?
Viewing a public profile, its posts and its comments does not notify the account, so the weekly routine is invisible to them. Stories are different: as of 2026 an account can see who viewed its stories, so skip them if you prefer to stay unnoticed.
What is a good engagement rate for a competitor?
Industry benchmark reports put typical Instagram engagement rates at roughly 1 to 3 percent, computed as likes plus comments divided by followers, times 100. Smaller accounts usually sit higher and very large ones lower, so compare each competitor with accounts of a similar size.
Should I track accounts that are much bigger than mine?
One, at most, and only for ideas about format and hooks. Their likes, comments and growth are driven by a distribution you do not have yet, so comparing your numbers to theirs will only discourage you. The accounts that teach you the most are one step ahead of you.
How long before the analysis pays off?
After about four weeks you have four data points per account, enough to tell a trend from a one-off. The ideas tab usually pays off faster, often in the first two weeks. Give the routine a full quarter before changing the list or the columns.
Related reading
- How to See Analytics of Other Instagram Accounts (What You Can and Can’t Know)
- Best Time to Post on Instagram in 2026 (and How to Find Yours)
- How Often Should You Post on Instagram? What the Accounts in Your Niche Actually Do
The bottom line
A useful Instagram competitor analysis is small and regular: 5 to 10 public accounts, six numbers you can actually see, a two-tab spreadsheet, and thirty minutes at the same time every week, split evenly between numbers, reading and ideas. Start by hand for the first month. When the numbers block starts eating the whole slot, a weekly recap with analytics such as Followcap Premium or Business Pro, which we make, can collect them for you, with the trade-off that it is weekly and covers public accounts only. Keep the reading and the ideas for yourself. That is the part that turns watching your competitors into better content of your own.