Competitor Content Analysis: How to Study What Works for Them, Step by Step
Competitor content analysis step by step: pick 5 to 10 accounts, build the sheet, find their top 10% posts, name the patterns, turn them into tests, repeat monthly.
 Andrea Marino10 min read
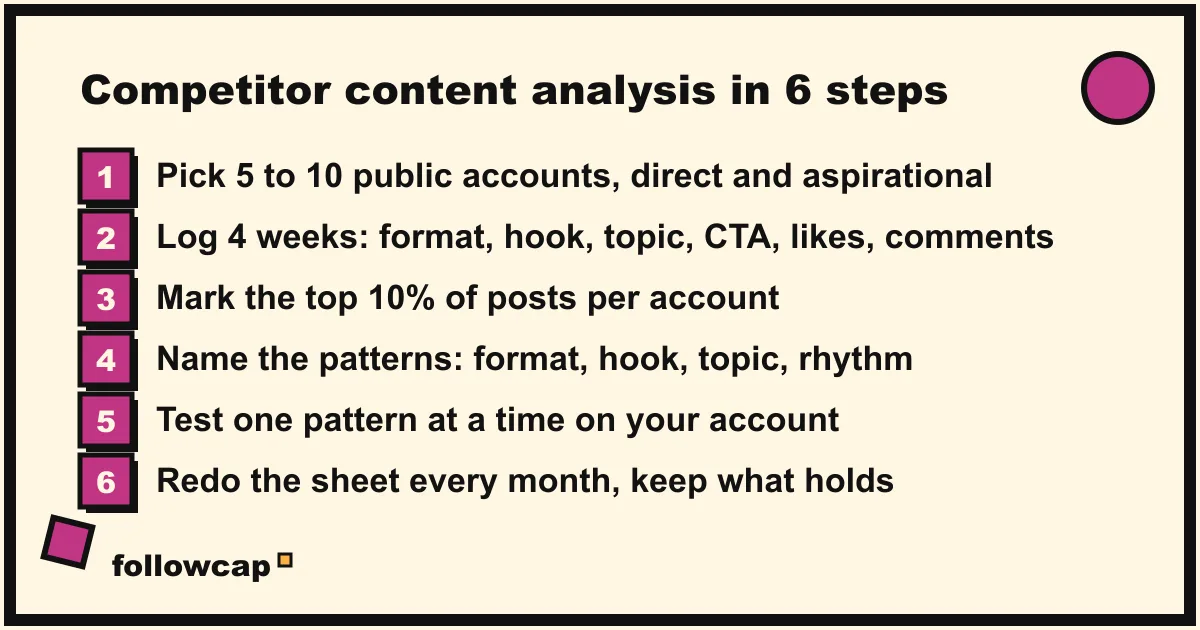
Competitor content analysis is the study of what the accounts in your niche publish and which of it works, done to find patterns you can test on your own account. The method: pick 5 to 10 public accounts, log their posts in a sheet, isolate the top 10%, name what those posts share, turn each pattern into a test, and repeat every month.
Quick answer: six steps. Pick 5 to 10 public business or creator accounts; log four weeks of their posts with date, format, hook, topic, CTA, likes and comments; mark the top 10% per account by likes plus comments over followers; write down what the winners share in format, hook, topic, rhythm and length; test one pattern at a time on your account, four posts, one variable; redo the sheet monthly.
What this analysis is, and what it is not
A benchmark tells you a competitor’s engagement rate is 0.9% against your 0.4%. A competitor content analysis tells you the 0.9% comes from seven-slide carousels with a question on the first slide, posted on Tuesday evenings. The first says you are behind; the second says what to try on Monday. The Instagram competitor analysis routine covers the numbers; this guide covers the content.
Step 1: Pick 5 to 10 accounts
Three groups, all public business or creator accounts:
- Direct competitors, two to four: same product, same audience, similar size.
- Adjacent accounts, two to three: a different product for the same people.
- Aspirational accounts, one to three: two to five times your size in the same niche, showing where the format is going before it reaches your tier.
Skip accounts far above your size: their worst image out-likes your best Reel and teaches nothing. Note each follower count on day one; step 3 needs it.
Step 2: Build the sheet
One row per post, ten columns, four weeks back. Our estimate is about 15 minutes per account per week (about four Reels to watch and note), so the first fill of a ten-account sheet is an afternoon’s work.
| Column | What to write |
|---|---|
| Date | Day the post went up |
| Account | Handle |
| Link | Post URL |
| Format | Reel (with length), carousel (with slide count), image |
| Hook | First caption line, or what happens in the first three seconds |
| Topic | Three words: “repotting myth”, “price reveal”, “new arrivals” |
| CTA | Save, comment a keyword, send, link in bio, none |
| Likes | The public count |
| Comments | The public count |
| Note | One line: a collab, a pinned post, a trend sound |
Likes are public unless the poster hid them: Instagram’s help page Hide or unhide like counts on Instagram posts and reels explains that a poster can hide like and view counts on a post before or after sharing it. Leave the cell empty when the count is hidden and score that post on comments alone; how to see someone’s most liked posts on Instagram covers the workarounds.
Step 3: Find their top 10%
Add a column: likes plus comments, divided by the account’s follower count, times 100. That is the engagement rate per post, the formula most benchmarks use, so accounts of different sizes sort together. Then, per account, not across accounts, sort by that column and mark the top 10% of rows: with 20 to 40 posts per account over four weeks, two to four posts each. Flag two more things: any post whose comments exceed 5% of its likes, which usually means a CTA or a controversy, and the bottom 10%, because what flopped for an account with your audience saves you a test.
Then read the winners properly: open each flagged post, watch the whole Reel, swipe every slide, read the top twenty comments. No sort replaces this, and it is where the patterns come from.
Step 4: Name the patterns
A pattern is something that appears in the winners of at least two accounts and rarely in the losers. Five places to look:
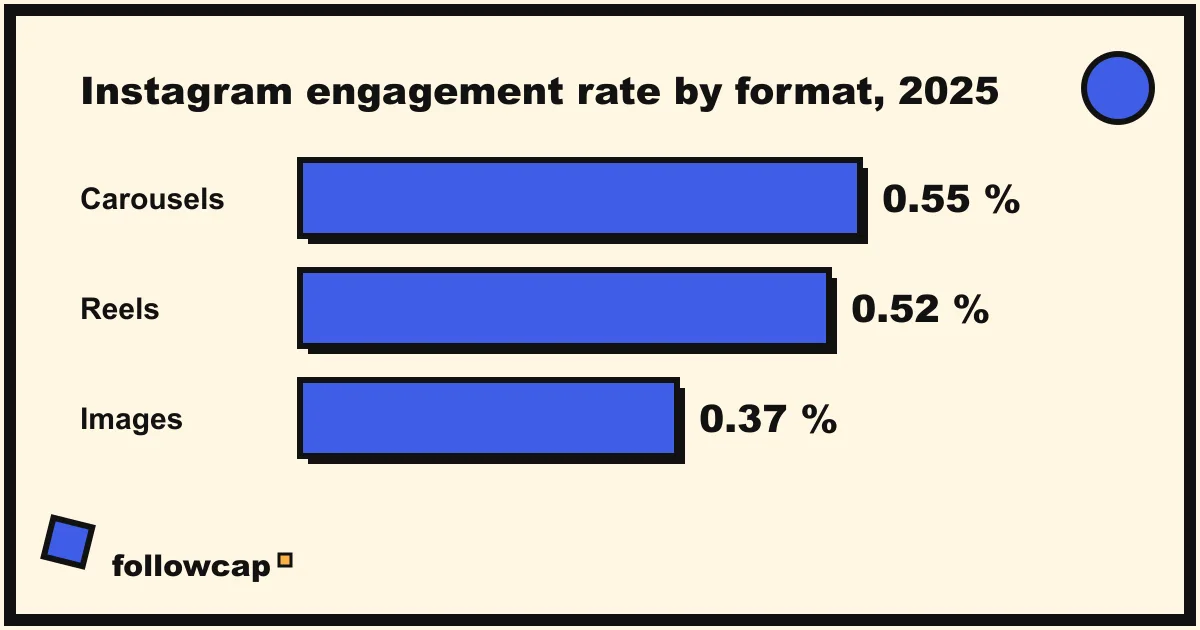
- Format. Which format fills the top 10%, and is it the one they post most? Market context helps: in Socialinsider’s 2026 Instagram organic benchmarks, from 67.5 million posts by business accounts with 1,000 to 1 million followers, carousels averaged a 0.55% engagement rate per follower in 2025, Reels 0.52% and images 0.37%. Buffer’s analysis of formats across 45 million posts adds the other half: carousels drew 109% more engagement per person reached than Reels, while the earlier Buffer reach study it cites found Reels reached 2.25 times as many people as single images. Reels for reach, carousels for depth.
- Hooks. Put every winner’s hook on one list and group them: a myth to stop believing, a diagnosis (“why your fern browns at the tips”), a number, a contrarian opinion, a price reveal. Two or three families usually cover most winners; 50 Instagram hook examples names the families and the mechanism behind each.
- Topics. Which three-word topics recur in the top 10%, and which in the bottom 10%? Product drops sit at the bottom for almost every account; post them, but do not expect growth from them.
- Rhythm. Days, times, posts per week. Rival IQ’s 2026 benchmark report puts the all-industry median for brands at 3.69 posts per week, so an account at eight or nine is betting on volume, and its sheet shows whether the bet pays per post.
- Length and CTA. Reel length of winners against losers, slide count of the winning carousels, and which CTA sits under the posts with the most comments. Metricool’s 2026 Instagram study of 24 million posts found carousels get nine times more saves than single images, which is why “save this” CTAs cluster under carousels and “comment a keyword” under Reels.
A filled example
The accounts below are invented, with plausible numbers, to show a sheet after step 3. Follower counts: @leafandloam 48,000, @pottedplans 31,000, @fernfolk.studio 12,000.
| Date | Account | Format | Hook | Topic | CTA | Likes | Comments | Rate |
|---|---|---|---|---|---|---|---|---|
| 3 Nov | @leafandloam | Reel, 22 s | “Stop watering your monstera on a schedule” | Care myth | Save this for Sunday | 4,120 | 212 | 9.0% |
| 29 Oct | @leafandloam | Carousel, 7 | “5 plants that survive a north-facing flat” | Low light | Send to a friend | 2,980 | 96 | 6.4% |
| 27 Oct | @pottedplans | Carousel, 5 | “The €12 soil mix we use for everything” | Soil recipe | Comment MIX | 3,310 | 388 | 11.9% |
| 1 Nov | @pottedplans | Reel, 41 s | “I repotted 30 plants in one afternoon” | Repotting day | None | 1,640 | 48 | 5.4% |
| 30 Oct | @fernfolk.studio | Reel, 15 s | “Why your fern browns at the tips” | Diagnosis | Follow for part 2 | 2,210 | 131 | 19.5% |
| 4 Nov | @fernfolk.studio | Image | New arrivals, Friday | Product drop | Link in bio | 410 | 9 | 3.5% |
Read across the three accounts and the patterns write themselves: winners open with a myth or a diagnosis, not an announcement; the two posts with the highest comment ratios ask for a specific comment or promise a part two; short Reels (15 to 22 seconds) beat the 41-second one; the product drop is the floor for every account.
Step 5: Turn patterns into tests
A pattern is a hypothesis about your audience, and the only way to confirm it is on your account. One pattern, one test, one variable:
- Four posts, two weeks. Fewer and one lucky post decides.
- Change one thing. A diagnosis hook on your usual Reel topic, at your usual length; test three things at once and you will not know which worked.
- Decide the measure before posting. Hooks: interactions and comments in your Insights against your last eight posts of the same format. Formats: reach and saves, which only your own Insights show. CTAs: comments and the words in them.
- Write the result in the sheet next to its pattern: “confirmed”, “no effect” or “worse”.
Step 6: Repeat monthly
Four weeks is one data point. Each month, add the new rows, re-sort, re-mark the top 10% and compare the pattern list with last month’s. Patterns that hold for three months are the ones to build on; patterns that appear once are weather. Twice a year, revisit step 1.
This is where tools enter. Followcap is our product, so read this as the maker’s description. You type the usernames of public Instagram creator or business accounts, no Instagram login or password needed, and every Sunday you get one email: a 30-second summary, the three posts not to miss, then each account’s best three posts (most liked and commented first) with a two to three line recap, the day and the link, and “what you can apply this week”. Reading it takes about five minutes a week, against about 15 minutes per account by hand, in our estimate. Three accounts are free, no card, no time limit. Premium (€9 a month, 10 accounts) adds the weekly numbers per account (posts, likes, comments, best post, follower growth) and an archive page that keeps every post of every week; Business Pro (€29 a month, 50 accounts, 3 team users) adds a dashboard with alerts and CSV export. Its limits: weekly, not real time; public creator and business accounts only; posts, likes, comments and follower counts, so no reach, saves, views, Stories, mentions, hashtags or audience data, and the Reel watching stays yours; paid plans are paid after the 7-day trial, with a 30-day money-back. The social media competitor analysis template is the free alternative.
What to copy and what never to copy
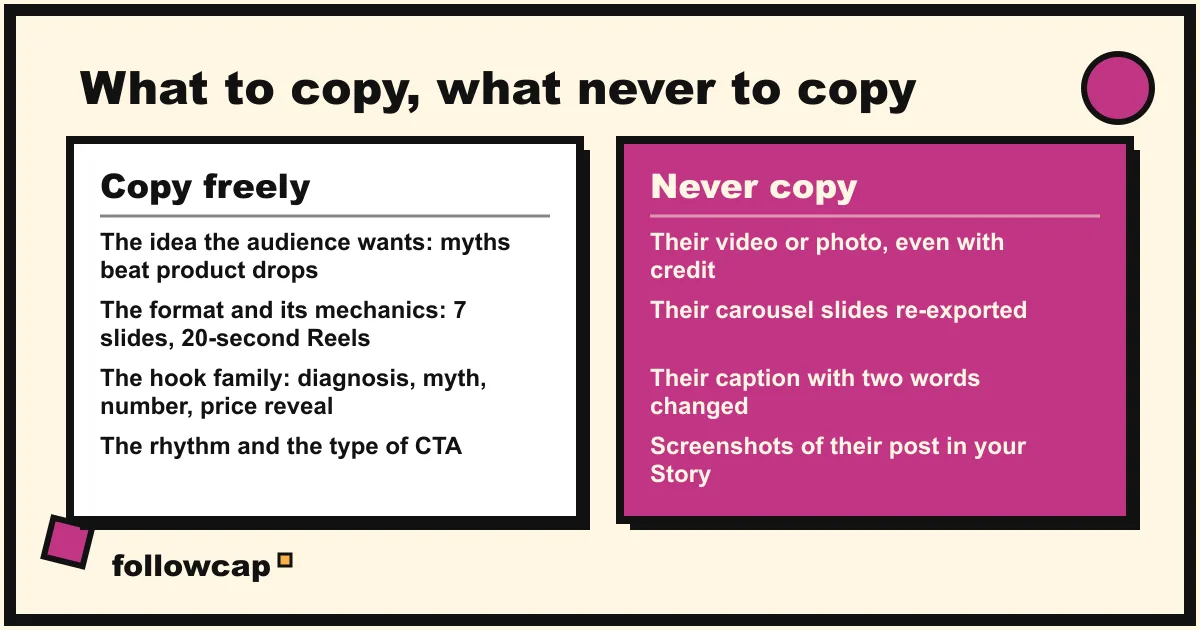
Copy freely: the idea an audience wants (“care myths outperform product drops”), the format and its mechanics (seven slides, a question on slide one, 20-second Reels), the hook family (diagnosis, myth, number), the rhythm, the type of CTA. None of these belong to anyone.
Never copy: the asset. Not their video, not their photo, not their carousel slides re-exported, not their caption with two words changed. Instagram’s help page on content that violates copyright says you can only post content that does not violate someone else’s intellectual property rights, that you can infringe even if you gave credit, added a disclaimer or modified the work, and that the safe route is written permission. Screenshots of their post in your Story count too. If a competitor’s post is worth showing your audience, link to it or use Instagram’s own repost features, which keep the asset with its owner; how to repost on Instagram covers what they allow.
FAQ
What is competitor content analysis?
It is the systematic review of what competing and reference accounts publish, which posts perform best by public signals such as likes and comments, and what those posts share in format, hook, topic, rhythm and call to action, to find patterns worth testing on your own account.
How many competitors should you analyse?
Five to ten: two to four direct competitors, two to three adjacent accounts aimed at the same audience, and one to three aspirational accounts a few times your size. Fewer and one odd month looks like a pattern; more and the sheet is abandoned.
How often should you do a competitor content analysis?
Monthly for the sheet and the pattern list, because four weeks gives 20 to 40 posts per account, enough to mark a top 10%. Quarterly for the account list and the deeper read.
Is it legal to analyse competitors’ Instagram content?
Reading and logging what public business and creator accounts publish is ordinary use of the platform. Two lines not to cross: giving your Instagram password to an app that promises competitor data, which Instagram’s terms treat as unauthorised access, and republishing their photos, videos or captions, which is copyright infringement even with credit.
Related reading
- 8 Best Instagram Monitoring Tools in 2026 (Creators and Brands)
- How to Keep Track of Competitors on Social Media Without a Big Budget
- How to Monitor Competitors on Social Media (a Weekly Routine)
The bottom line
A competitor content analysis is six steps and one sheet: 5 to 10 public accounts, four weeks of posts with format, hook, topic, CTA, likes and comments, the top 10% per account, the patterns the winners share, one test per pattern on your own account, and the same sheet again next month. The numbers are public and the reading is yours; a weekly recap such as Followcap, which we make, saves the collecting but not the thinking. Borrow the pattern, never the asset, and after three months the sheet holds what works for your audience.