Social Media Competitor Analysis Template (Free, Weekly)
A free social media competitor analysis template: two tabs, the exact columns, a 5-point weekly score and a one-page summary you can paste into Google Sheets today.
 Andrea Marino10 min read
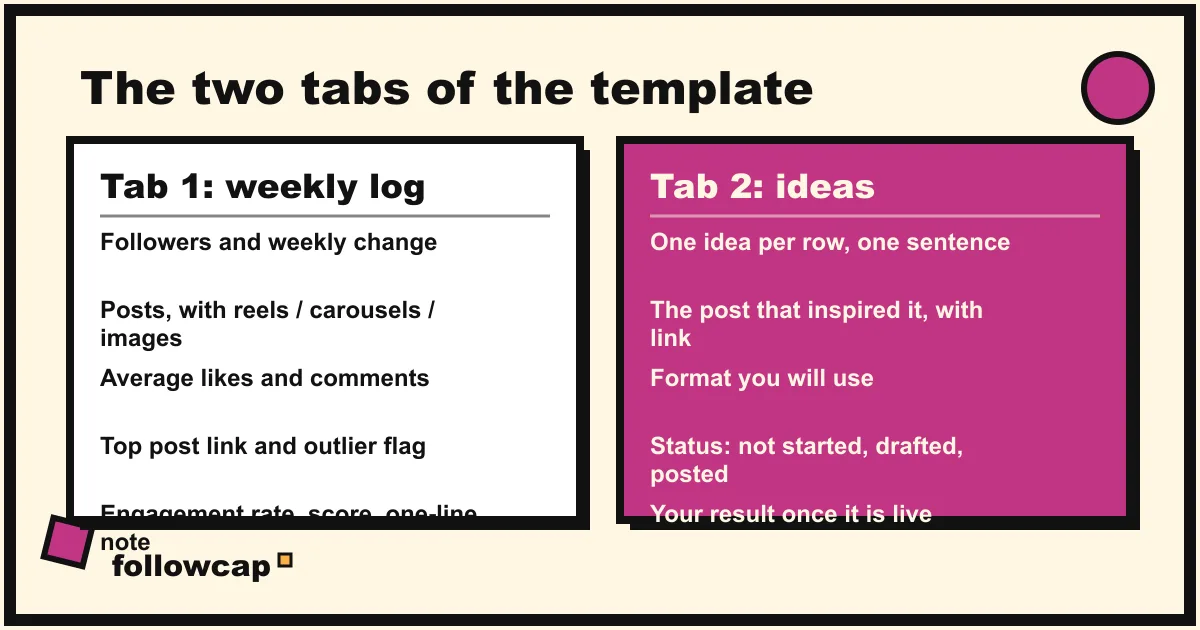
Most competitor analysis templates are a one-off audit: forty cells, filled once, never opened again. This one is built to be filled every week in under half an hour, which is the only way numbers turn into trends. Two tabs, a handful of columns, a simple score and a one-page summary. Copy the tables below into Google Sheets or Excel and the setup is done.
Quick answer: use two tabs. Tab 1 is the weekly log: one row per account per week, with followers, follower change, posts, format split, average likes, average comments, top post, outlier and a one-line note. Tab 2 is the ideas tab: one row per idea, tied to the post that inspired it, with a status. Score each account 0 to 5 every week, write a one-page summary once a month, and record on the same day each week.
Why a weekly template beats a one-off audit
A single audit tells you where a competitor is today. It cannot tell you whether they are growing, slowing or pivoting to video, because those are changes, and a change needs two data points. Four weekly rows per account show a direction; twelve are enough to trust it.
The second reason is effort. A template you fill every Monday has to be small, or you stop by week three. Everything below fits in thirty minutes for 5 to 10 accounts. The routine behind it is in Instagram competitor analysis: a 30-minute weekly routine; this article is the template itself.
What can a competitor analysis template actually track?
Only what is public. On Instagram, as of 2026, anyone can see an account’s follower and following counts, number of posts, likes per post (unless the account hides them), comments, the view count shown on a reel, captions, hashtags and posting dates. Nobody outside the account can see reach, impressions, saves, shares, watch time, story views or audience demographics. The split is explained in how to see analytics of other Instagram accounts.
So every column below is a public number or something derived from one. If a template you find elsewhere has a “competitor reach” column, it is either an estimate or an empty cell. The same columns work for TikTok, LinkedIn or YouTube with the format names swapped; we use Instagram because it is where we run the template ourselves.
Tab 1: the weekly log
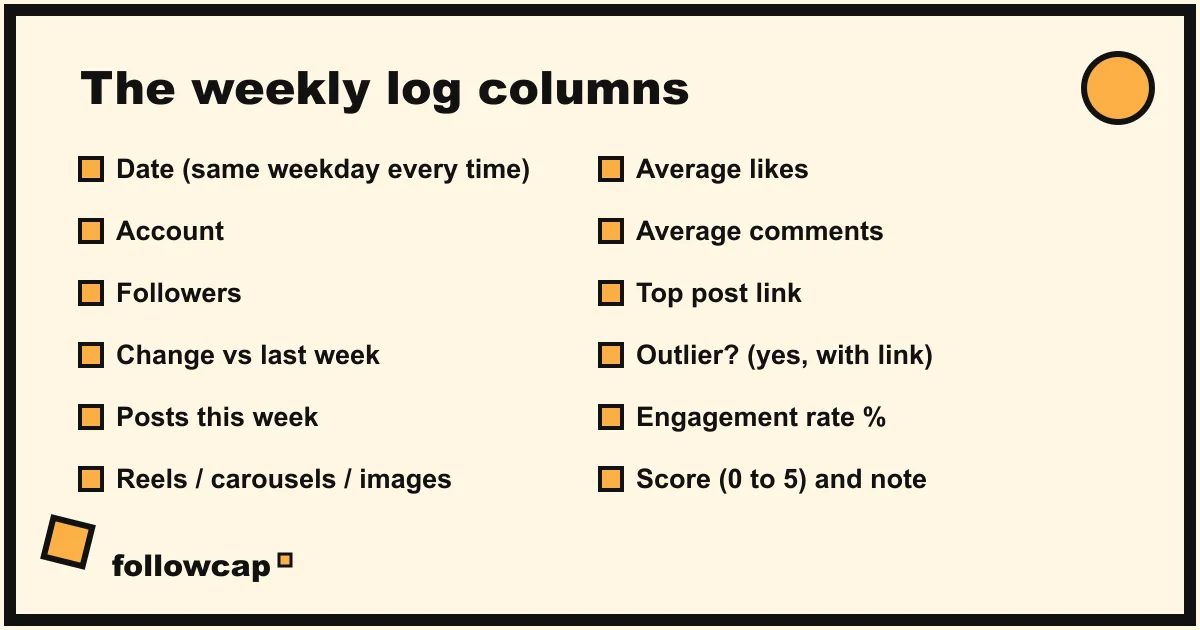
One row per account per week. Paste this header row into a sheet; the second row is a filled example so the columns are unambiguous.
| Date | Account | Followers | Change | Posts | Reels / Carousels / Images | Avg likes | Avg comments | Top post (link) | Top post likes or views | Outlier? | ER % | Score | Note |
|---|---|---|---|---|---|---|---|---|---|---|---|---|---|
| 2026-11-02 | @example | 24,300 | +310 | 5 | 3 / 1 / 1 | 820 | 41 | instagram.com/p/… | 3,900 views | Yes (link) | 3.5 | 4 | Reel on pricing mistakes, comments full of questions |
What each column means:
- Date. Always the same weekday, so each row covers the same seven days.
- Followers and Change. The count today and the difference from last week’s row. Change is the useful one.
- Posts and format split. Everything published in the last seven days: reels, carousels, single images.
- Avg likes, Avg comments. Week’s totals divided by the number of posts. Leave likes blank for accounts that hide them.
- Top post. The post with the most likes, or views for a reel, with its link. The one you read properly.
- Outlier? Yes if any post sits at two to three times the account’s usual likes, comments or views. Paste the link.
- ER %. Average likes plus average comments, divided by followers, times 100. Method and limits in how to check any account’s engagement rate.
- Score. The 0 to 5 number explained below.
- Note. One line after reading the top post: the hook, and what the comments said.
Add a formula for Change and ER so you only type raw numbers. In Google Sheets, with followers in column C and last week’s row directly above, Change is =C3-C2 and ER is =(G3+H3)/C3*100.
Tab 2: the ideas tab
This tab is the product. The log says what competitors did; this tab records what you will do about it.
| Date | Idea (one sentence) | Inspired by (link) | Account | Format | Status | Posted on | Your result |
|---|---|---|---|---|---|---|---|
| 2026-11-02 | A carousel listing the five pricing questions clients ask before signing | instagram.com/p/… | @example | Carousel | Drafted |
Three rules:
- Every idea links to a specific post. “Do more reels” is not an idea. “A reel answering the top comment on that post” is.
- Take the question or the format, never the content. Same underlying need, your own angle, your own experience.
- Fill in your result once the post is live. After a quarter you can sort by result and see which competitor is worth watching.
Status has four values: not started, drafted, posted, dropped. Dropped is fine; it keeps the tab honest.
How do you score each competitor every week?
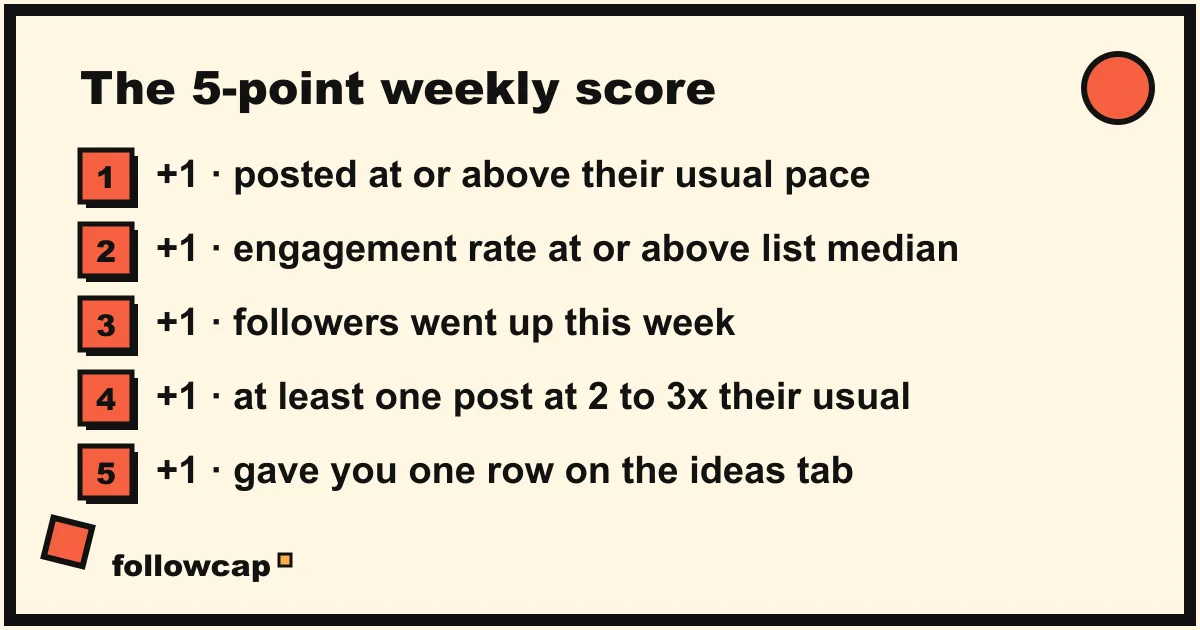
A score forces a decision and makes the log sortable. Ours is five yes-or-no questions, one point each, per account per week:
- Pace: did they post at least as often as their own average? Compare this week’s count with the mean of the previous four rows.
- Engagement: is their ER at or above the median of your list? Compute the median ER across all accounts this week. Use comments only for accounts that hide likes.
- Growth: did followers go up? Any positive change scores. Direction over several weeks matters more than size.
- Outlier: did any post reach two to three times their usual numbers? One is enough.
- Idea: did their content give you one row on the ideas tab? The only subjective point, and the one that matters most.
A 4 or 5 means a strong week: read everything they posted. A 0 or 1 for three weeks running means they are coasting; swap them for someone more active. Over a month, the average score per account is a cleaner ranking than follower count.
If you want an external yardstick for the engagement point, benchmark reports exist. Rival IQ’s 2024 Social Media Industry Benchmark Report, which looks at brand accounts, put the median Instagram engagement rate across industries at roughly 0.43 percent per post, measured as engagements divided by followers, and the median brand posting pace at roughly 4.2 posts a week; its 2025 edition reports a further dip. Creators and small accounts usually run well above that, so for a list of creators your own list’s median is the fairer bar.
The one-page summary for a client or a team
Once a month, or whenever someone asks “what are the competitors doing?”, turn the log into one page. Nobody reads the sheet; everybody reads this.
COMPETITOR SUMMARY: [niche], [month]
Accounts tracked: 8 · Weeks of data: 4

THE ONE THING
One sentence: the biggest change in the niche this month.

RANKING (average weekly score)
1. @account · 4.2 · growing, 5 posts/week, two outliers
2. @account · 3.5 · steady, pivoted to carousels
3. @account · 2.0 · posting less, ER down

NUMBERS THAT MOVED
- Followers: who gained most, who lost
- Posting pace: who sped up or slowed down
- Format: share of reels this month vs last

THREE POSTS WORTH SEEING
1. Link · why it worked, one line
2. Link · why it worked, one line
3. Link · why it worked, one line

WHAT WE DO NEXT
- Three ideas from the ideas tab, each with a status
The ranking line per account carries most of the value: a score, a direction and three words. For a fuller client format that also includes your own Insights numbers, see the social media report template for clients.
How do you keep the template going every week?
The template is easy; the habit is the hard part. What works for us:
- One calendar block, same day, same time. Thirty minutes on Monday morning.
- Record first, read second. Fill the numbers for every account before opening any post properly.
- Hard cap of 10 accounts. To add one, drop one.
- Freeze the columns for a month. Every extra cell costs you across every row forever.
- Note missed weeks rather than back-filling from memory.
The numbers block is the part that gets automated first, and here we should be transparent: Followcap is our product, so read this as the maker’s description. You type the usernames of public Instagram creator or business accounts, with no Instagram login, and every Sunday get one email with a short recap and the link of the best posts from those accounts, which covers the reading block. Three accounts are free. Premium (€9 a month, up to 10 accounts) adds a weekly line of numbers per account that maps onto the log columns: posts, likes, comments, best post and follower growth, plus an archive page of every recap. Business Pro (€29 a month, up to 50 accounts, 3 team users) adds a monitoring table with alerts on spikes, CSV export you can paste into the log, a “you vs your niche” view and a monthly PDF report. The limits: it is weekly, not a live dashboard; it covers public creator and business accounts only; it cannot show reach, saves, views, watch time or audience data, because nobody outside the account can; and it is paid after the 7-day free trial, with a 30-day money-back after the first charge. If the numbers block is what you want to hand off, you can start with your list. The ideas tab and the score stay manual, because they are the thinking.
Which mistakes make the template useless?
- Recording on different days. Likes keep arriving for days after a post. A Monday row and a Thursday row are not comparable.
- Tracking accounts ten times your size. Their numbers reflect distribution you do not have yet. Keep most of the list within a few multiples of your own followers.
- Scoring by gut. The five questions are yes or no on purpose.
- Skipping the note column. In three months the numbers mean nothing without the line that says what the post was.
- Never writing the summary. The log is for you; the summary is for everyone else.
FAQ
Can I use this template for platforms other than Instagram?
Yes. Keep the structure and swap the format split and the public counts: views and comments on TikTok or YouTube, reactions and comments on LinkedIn. Only record numbers the platform shows publicly.
How many competitors should the template include?
Five to ten. Fewer and you are watching one rival; more and the weekly numbers take longer than the thinking. Mix direct competitors near your size with two or three accounts slightly ahead of you.
Should I track my own account in the same log?
Yes, as one more row, using the same public numbers so the comparison is fair. Keep your Insights numbers (reach, saves, shares) in a separate tab or in your client report, because competitors have no equivalent.
How long before the template shows anything useful?
The ideas tab pays off in the first week or two. The log needs about four rows per account before Change and the score mean anything, and a full quarter before you can rank accounts with confidence. Keep the same columns for that quarter.
Is a spreadsheet enough, or do I need a tool?
A spreadsheet is enough for the first month and teaches you what the numbers mean. Tools help when the recording block eats the whole half hour, or when a team needs the same data. A comparison of options is in the best Instagram monitoring tools.
Related reading
- The Best Instagram Analytics Tools in 2026 (Yours and Others’)
- Best Time to Post on Instagram in 2026 (and How to Find Yours)
- How to See Instagram Insights (and What Each Number Means)
The bottom line
A competitor analysis template earns its keep by being small enough to fill every week: a log tab with fourteen columns, an ideas tab with eight, a 5-point score and a one-page summary once a month. Build it in Sheets with the tables above, record on the same day each week, and give it a quarter. When the numbers block is the bottleneck, a weekly recap with analytics such as Followcap Premium or Business Pro, which we make, can fill the log columns for public accounts, with the trade-off that it is weekly and public data only. The score and the ideas stay yours, and they are the part that turns a template into better content.