Instagram Engagement Rate Benchmarks by Industry and Account Size (2026)
Instagram engagement rate benchmarks for 2026: the formula, ranges by account size and industry from published reports, and why the numbers differ so much.
 Andrea Marino9 min read
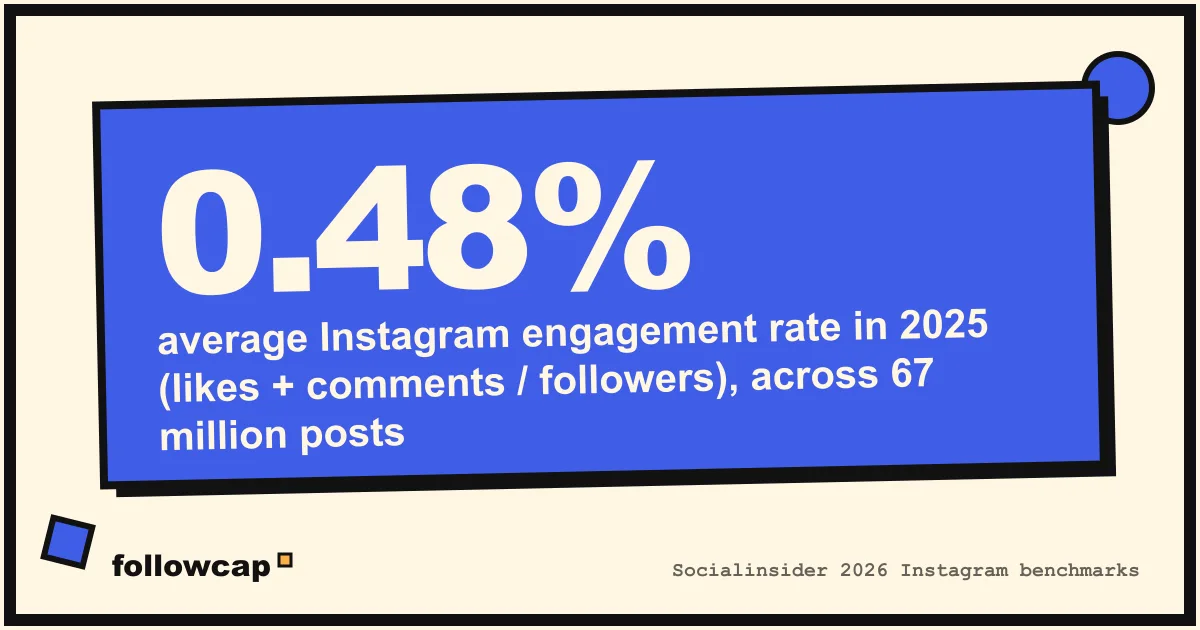
Every year several analytics companies publish Instagram engagement rate benchmarks, and every year the numbers disagree by a factor of ten. One report says the median brand gets 0.4 percent; another says the average account gets 4 percent. Both can be right, because they measure different things. This page collects the published figures we could verify, by account size and by industry, with the formula behind each, and shows how to use them for the accounts you track.
Quick answer: the public formula is likes plus comments, divided by followers, times 100. Brand benchmark reports using that formula (Rival IQ, Socialinsider, Dash Social) put the typical brand account at roughly 0.4 to 0.5 percent in their latest editions. Creator benchmarks from HypeAuditor run from roughly 4 to 5 percent for accounts with 1K to 5K followers down to 1 to 2 percent above 500K. Hootsuite, which measures per post on each industry’s best-performing format, reports 3 to 5.5 percent by industry. Compare an account only with figures that use the same formula and a similar size.
Which formula do the benchmarks use?
Before any number, check the denominator. The reports on this page use three different methods.
- Follower-based, per post. (likes + comments) ÷ followers × 100, averaged over an account’s posts. Socialinsider uses exactly this. Rival IQ counts interactions (likes, comments, shares and reactions where available) divided by followers, and reports medians. Dash Social calls it “engagement rate by followers”. Every input is public, which is why you can compute it for any account.
- View-based. (likes + comments) ÷ views × 100. Dash Social reports a second “by views” figure, and HypeAuditor has moved its calculator to this version for accounts with enough reels. Never compare it with a follower-based number.
- Per post on the best-performing format. Hootsuite measures engagement per post against followers, on each platform’s best-performing content type. That selection pushes the figures up, which is why Hootsuite’s industry numbers sit far above the others.
The step-by-step method for any public account, with the reel version kept separate, is in Instagram engagement rate: formula, benchmarks, how to check.
Instagram engagement rate benchmarks by account size
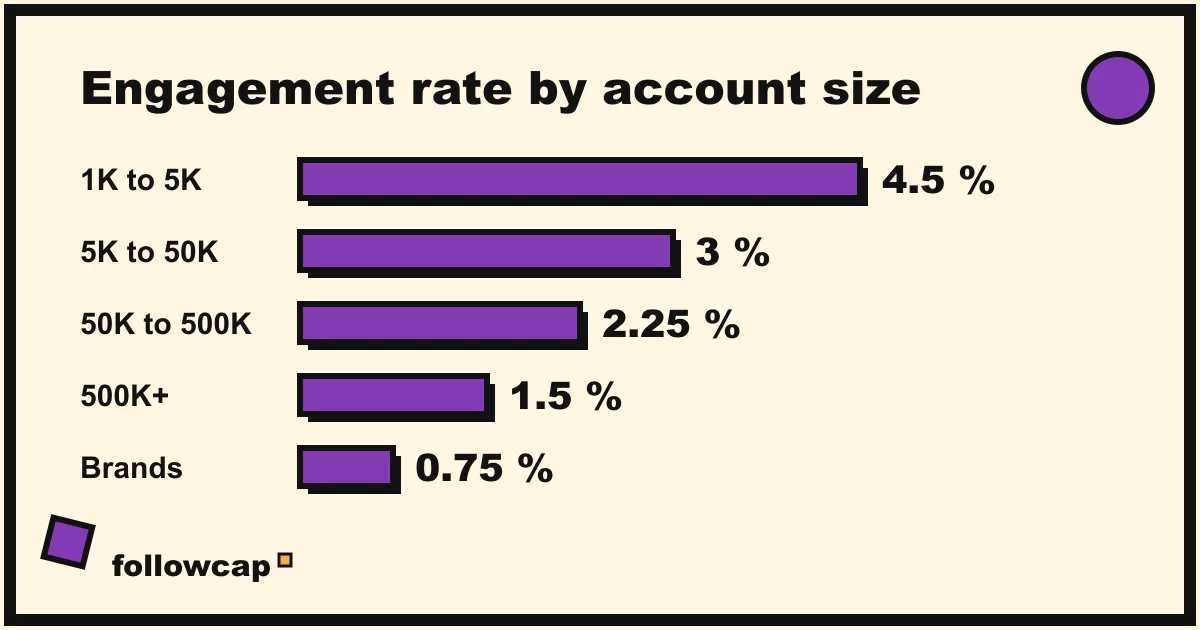
Size is the biggest single driver of the rate, bigger than industry. A few hundred engaged followers are a large share of 3,000 and a rounding error on 3 million.
The clearest published ranges by size come from HypeAuditor, which describes them as rough benchmarks based on its own data, in a piece first published in 2025 and updated in 2026:
| Account size | HypeAuditor rough benchmark |
|---|---|
| 1K to 5K followers (nano) | 4 to 5 percent |
| 5K to 50K (micro) | roughly 2.5 to 3.5 percent |
| 50K to 500K (mid-tier) | roughly 2 to 2.5 percent |
| 500K and above (macro and mega) | roughly 1 to 2 percent |
| Brand accounts, for comparison | often around 0.5 to 1 percent |
The chart above shows the middle of each range: 4.5, 3, 2.25, 1.5 and 0.75 percent. Treat the ranges as the finding, not the midpoints.
The same slope shows up in raw counts. Socialinsider’s 2026 Instagram benchmarks, built on about 67 million organic posts from 2025, put average comments per reel at about 3 for accounts with 1K to 5K followers and about 60 for accounts with 100K to 1M. Followers rose by a factor of roughly a hundred between those tiers; comments by a factor of twenty. That gap is the falling rate.
So the first rule of benchmarks: find your tier before you find your number. A 2 percent rate is quiet for a 3,000-follower account and outstanding for a brand with 300,000.
Instagram engagement rate benchmarks for brands, all industries
Once you line up the formula, the brand reports agree more than the headlines suggest.
- Rival IQ put the all-industry Instagram median at 0.43 percent in its 2024 Social Media Industry Benchmark Report, computed as interactions divided by followers across 150 companies in each of 14 industries, with a median posting frequency of 4.2 posts a week. Its 2025 edition says Instagram engagement “dipped across the board”, with retail the hardest hit.
- Socialinsider reports an average of 0.48 percent for 2025, using likes plus comments divided by followers per post, across about 67 million organic posts from professional accounts with 1K to 1M followers. It describes this as a 24 percent decrease year on year.
- Dash Social reports an all-industry average engagement rate by followers of 0.4 percent in its 2026 Instagram Benchmark Report, and 2.6 percent by views.
Put together: a typical professional account in 2025 sat at roughly 0.4 to 0.5 percent of followers per post, and the trend is down. An account above 1 percent with more than 10,000 followers is comfortably ahead of the brand medians.
Format matters less than size but it shows. Socialinsider’s 2025 averages by post type are 0.55 percent for carousels, 0.52 percent for reels and 0.37 percent for images.
Instagram engagement rate benchmarks by industry
Industry figures come in two flavours that must not be mixed. Dash Social’s 2026 report gives follower-based rates for a handful of consumer categories:
| Industry (Dash Social, 2026, by followers) | Engagement rate |
|---|---|
| CPG | 0.5 percent |
| Food and beverage | 0.5 percent |
| Beauty | 0.3 percent |
| Fashion | 0.2 percent |
| Retail | 0.2 percent |
Hootsuite’s 2026 benchmarks, measured per post on each industry’s best-performing content type, give a much higher scale:
| Industry (Hootsuite, 2026, per post, best format) | Engagement rate |
|---|---|
| Nonprofit | 5.5 percent |
| Education | 5.4 percent |
| Healthcare, pharma and biotech | 4.5 percent |
| Technology | 4.2 percent |
| Financial services | 4.1 percent |
| Dining, hospitality and tourism | 3.7 percent |
| Consumer goods and retail | 3.6 percent |
| Media and entertainment | 3.2 percent |
Two patterns survive the difference in method. Fashion, beauty and retail sit at the bottom of whichever list they appear in; Rival IQ’s 2025 edition singles out retail, with its median rate falling by more than half year on year. Education, nonprofits and other “cause” or “learning” categories sit near the top. If your niche is in neither table, build your own benchmark from the accounts around you, covered below.
Why do the benchmark reports disagree so much?
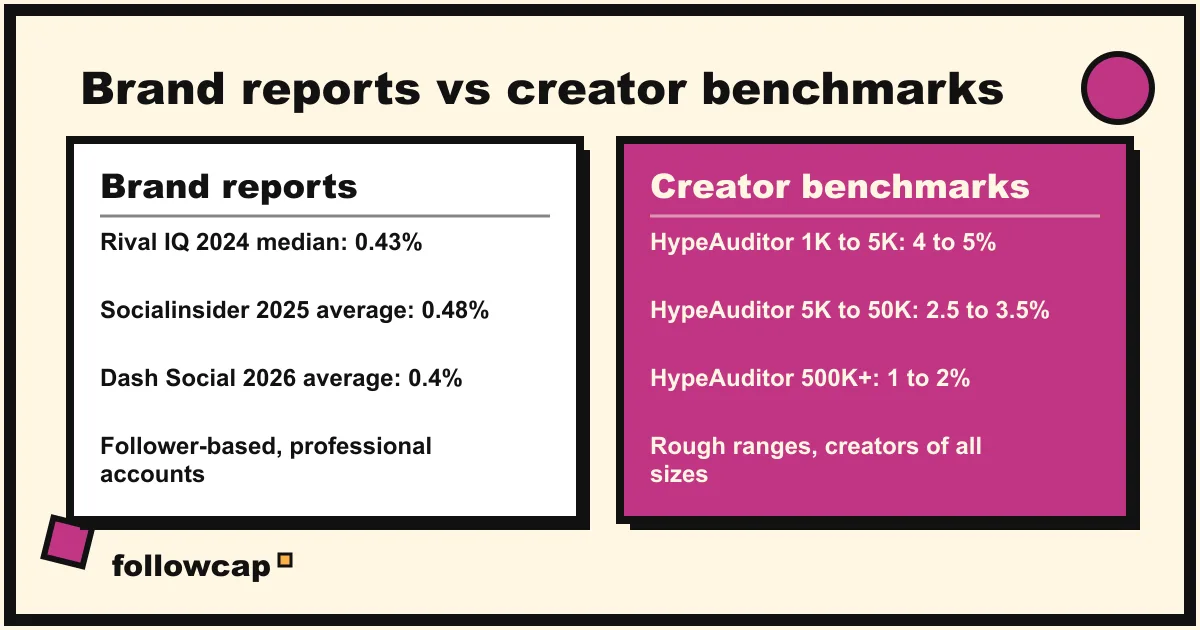
Four reasons, in order of importance.
- Different samples. Rival IQ, Socialinsider and Dash Social measure brands and professional accounts. HypeAuditor measures creators, including thousands of tiny accounts. A creator at 3,000 followers with a real community will always post a higher rate than a retail chain.
- Different formulas. Followers in the denominator gives one number, views another, and selecting the best-performing format a third. Dash Social’s own figures show it: 0.4 percent by followers and 2.6 percent by views.
- Median versus average. Rival IQ reports medians, which ignore the few viral accounts. Socialinsider reports averages, which include them, so they run higher.
- Different years. Engagement has been sliding for several years in every report that tracks it, so a 2023 figure is already out of date.
The practical consequence: never quote a benchmark without its formula, sample and year. “Industry average is 1 percent” is not a fact; “Rival IQ’s 2024 median for brands is 0.43 percent, follower-based” is.
How to use these benchmarks for the accounts you track
Global numbers tell you which tier you are in. Your real benchmark is the 5 to 10 accounts in your niche at a similar size.
- Compute the follower-based rate for each account over its last 10 to 12 posts, skipping the last 48 hours, with a separate column for reels divided by views.
- Take the median of the group, not the average, so one viral account does not set the bar.
- Place each account against that median and against its own last twelve weeks. A rate moving one way for three weeks is a story; a single reading is a number.
- Watch growth and engagement together. Follower growth ahead of engagement usually means the new followers are the wrong ones, or were bought. The curve shapes are in the Instagram follower growth tracker guide.
By hand this is 20 to 30 minutes a week for ten accounts, the routine described in Instagram competitor analysis. If you want the inputs collected for you, we should be transparent about our own option: Followcap is our product, so read this as the maker’s description. You type the usernames of public Instagram creator or business accounts, with no Instagram login, and every Sunday one email arrives with a short summary of their week, the three posts not to miss, a recap of the best posts from each account with their links, and a note on what to apply. Premium (€9 a month or €90 a year, up to 10 accounts) adds the weekly numbers per account, posts, likes, comments, best post and follower growth, which are the inputs of the public formula, plus an archive of every recap. Business Pro (€29 a month, up to 50 accounts, three team users) adds a “you vs your niche” comparison, alerts on spikes in likes and comments, and CSV export. The limits are those of the public formula itself: it is weekly, not a live dashboard; public creator and business accounts only; it cannot show reach, saves, views, watch time or audience data, because nobody outside the account can; and it is paid after the 7-day trial, with a 30-day money-back after the first charge. Three accounts are free if you want to try it on your list.
FAQ
What is a good Instagram engagement rate in 2026?
It depends on size and formula. Using likes plus comments divided by followers, brand reports put typical professional accounts at roughly 0.4 to 0.5 percent, and HypeAuditor’s rough creator benchmarks run from about 4 to 5 percent at 1K to 5K followers down to 1 to 2 percent above 500K. Above the figure for your tier is good; twice it is strong.
Is a 1 percent engagement rate good on Instagram?
For a brand or any account above 50,000 followers, yes: it is roughly double the latest brand figures from Rival IQ, Socialinsider and Dash Social. For a creator with 3,000 followers it is low, since HypeAuditor’s range for that size starts around 4 percent.
Do reels get higher engagement than posts?
Not by much, on the follower-based formula. Socialinsider’s 2025 averages are 0.55 percent for carousels, 0.52 percent for reels and 0.37 percent for single images. Reels reach more non-followers, which shows up in views, not in the follower-based rate.
Should I use reach instead of followers?
For your own account, yes: Instagram Insights gives you reach, and interactions divided by reach is the more accurate reading. For any other account you have no choice, because reach is private. Benchmark reports use followers for the same reason, so stick with the follower-based number when comparing, averaged over 10 to 12 posts.
Related reading
- Instagram Follower Growth Rate: Formula, Benchmarks and How to Track It
- How Often Do Brands Post on Instagram? Posting Frequency Benchmarks (2026)
- The Best Instagram Analytics Tools in 2026 (Yours and Others’)
The bottom line
Instagram engagement rate benchmarks only mean something next to their formula, sample and year. On the public formula, likes plus comments divided by followers, the latest brand reports from Rival IQ, Socialinsider and Dash Social put typical professional accounts at roughly 0.4 to 0.5 percent and falling; HypeAuditor’s rough creator ranges run from 4 to 5 percent for the smallest accounts to 1 to 2 percent for the largest; and Hootsuite’s per-post, best-format figures sit at 3 to 5.5 percent by industry. Find your tier, then build your own benchmark from 5 to 10 similar accounts and track it weekly. If you want those weekly inputs delivered, Followcap Premium, which we make, sends the public numbers for your list every Sunday, weekly and public accounts only.