Instagram Follower Growth Rate: Formula, Benchmarks and How to Track It
Instagram follower growth rate: the formula, a worked example, 2025 benchmarks by account size, how to read it in Insights or log it for any public account.
 Andrea Marino11 min read
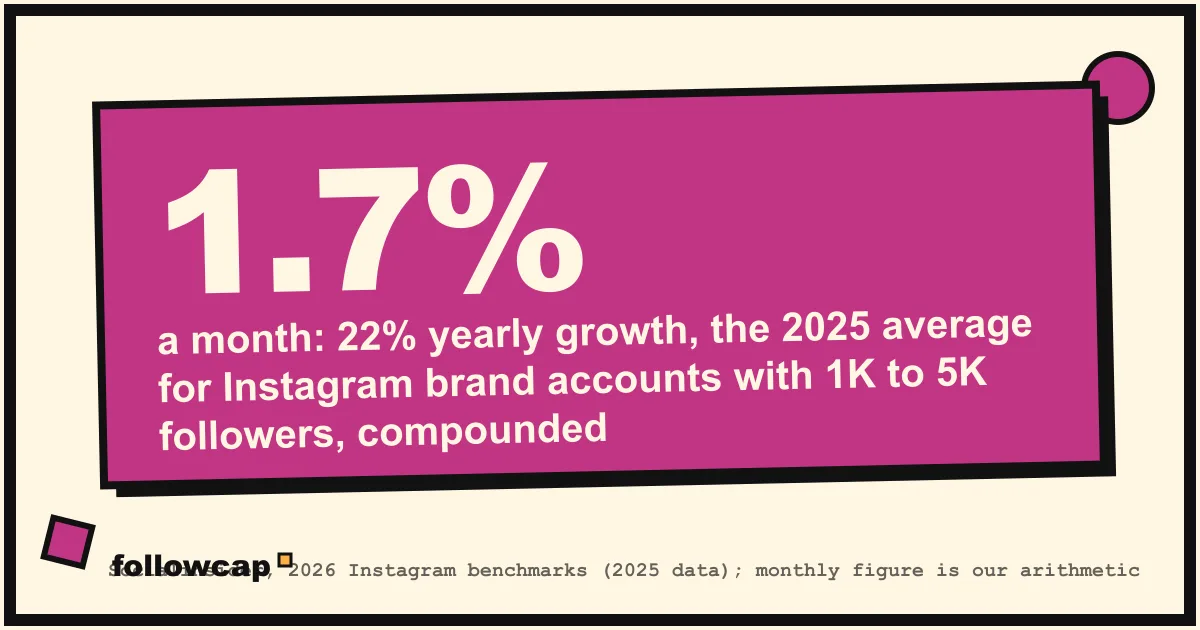
Instagram follower growth rate is the percentage change in an account’s followers over a period, usually a month: net new followers divided by the followers you started with, times 100. The latest large benchmark puts typical growth for brand accounts in 2025 at 11 to 22 percent for the year, roughly 1 to 2 percent a month, with smaller accounts at the top of that range.
Quick answer: growth rate = (followers at the end of the month minus followers at the start) ÷ followers at the start × 100. Socialinsider’s 2025 data gives accounts with 1K to 5K followers an average of 22 percent a year (about 1.7 percent a month compounded) and accounts with 100K to 1M followers 11.25 percent (about 0.9 percent a month). Read your own rate in Insights under Total followers; for any public account, log the count on the same day each week.
The formula
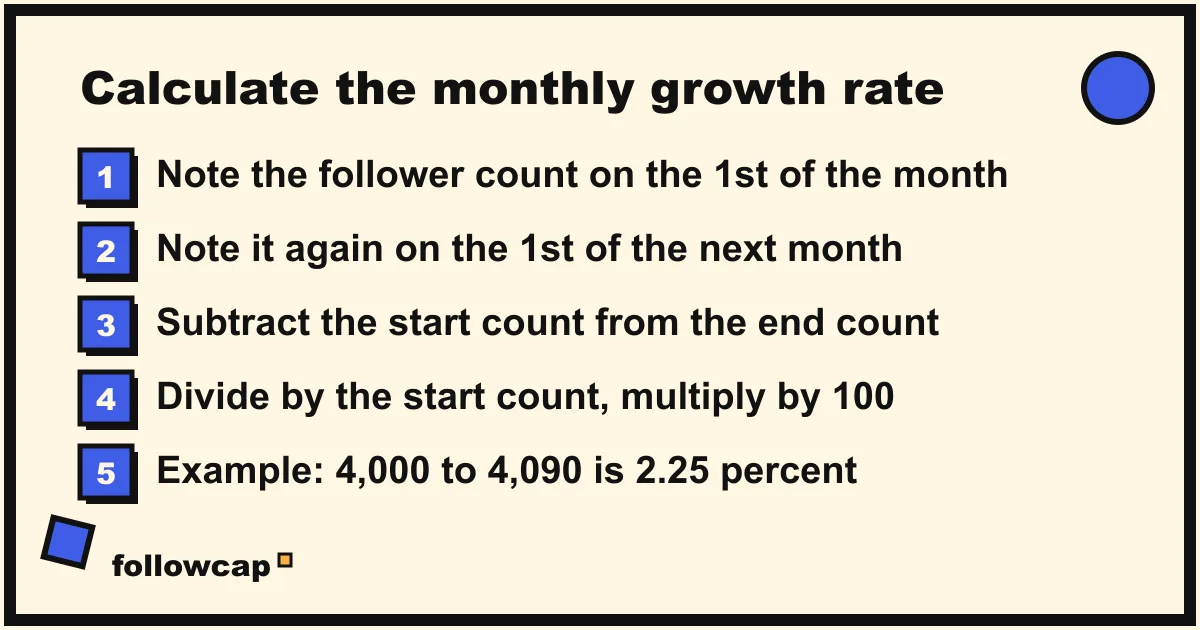
Follower growth rate = (followers at end − followers at start) ÷ followers at start × 100
The numerator is net: followers gained minus followers lost. You only need the count at the start and at the end of the period, which is why the formula works for accounts you do not own.
A worked example, monthly. An account has 4,000 followers on 1 October and 4,090 on 1 November. Net new followers are 90. 90 ÷ 4,000 = 0.0225, times 100 is 2.25 percent for October. If the same account had 3,960 on 1 November instead, the rate is −40 ÷ 4,000 × 100, or −1 percent.
Three rules keep the figure honest:
- Divide by the starting count, never the ending one. Dividing by the end count makes growth look smaller and losses look larger.
- Use the same period length every time. A month is the standard unit for benchmarks; a week is the practical unit for a log.
- Do not multiply a monthly rate by 12 to get a yearly one. Growth compounds: 1.7 percent a month is 22 percent a year, not 20.4.
In a spreadsheet, with the starting count in B2 and the ending count in B3: =(B3-B2)/B2*100.
Why the rate beats the raw count
A follower count is a stock; growth is a flow, and the flow carries the information. “Plus 500 followers this month” is a great month for an account with 5,000 followers (10 percent) and a flat one for an account with 500,000 (0.1 percent). The rate puts both on the same scale, which any comparison with peers or benchmarks needs.
The raw number still matters for context, so keep both columns: rate for comparison, count for the size of what happened.
Benchmarks: what a normal growth rate looks like in 2025 data
There is no official figure from Instagram, and most “average growth rate” numbers online trace to no dataset. Two published sources do state their method, and they disagree in an instructive way.
The larger one is Socialinsider’s 2026 Instagram benchmarks, built on 67.5 million organic posts from about 579,000 brand accounts with 1K to 1M followers, with 2025 as the data year. It defines growth as the followers gained during the year divided by the followers at the start of the year, times 100, averaged within each size bracket. The yearly averages, with 2024 alongside:
| Account size | Average growth, 2024 | Average growth, 2025 | Monthly equivalent, 2025 (compounded) |
|---|---|---|---|
| 1K to 5K followers | 38.0% | 22.0% | about 1.7% |
| 5K to 10K | 35.0% | 20.3% | about 1.6% |
| 10K to 50K | 33.8% | 17.2% | about 1.3% |
| 50K to 100K | 30.0% | 13.6% | about 1.1% |
| 100K to 1M | 27.0% | 11.3% | about 0.9% |
The monthly column is our own arithmetic (the twelfth root of the yearly growth, minus one), not a figure from the report. Smaller accounts grow faster in percentage terms, because every new follower is a bigger share of a small base. And growth roughly halved from 2024 to 2025 in every bracket, which fits the slide in engagement the same study reports: an average engagement rate of 0.48 percent in 2025, down from 0.50 percent.
The second source is Buffer’s Instagram benchmarks page, which on the day we checked (last updated 25 October 2026) showed an average monthly follower growth rate of 13.8 percent across all tiers, defined as the average followers gained during the month relative to the previous month. That is eight times the Socialinsider figure, and the sample explains the gap: Buffer’s number comes from roughly 273,000 accounts connected to Buffer, including a 0 to 1K tier where an account going from 20 to 40 followers posts a 100 percent month, and an average is dragged up by exactly those accounts. Socialinsider starts at 1,000 followers and covers brands. Neither is wrong; they measure different populations.
So the honest reading for an account of 1,000 to 1 million followers: around 1 to 2 percent a month is typical, 2 to 3 percent sustained over a quarter is strong, and anything above 5 percent a month for an established account is a viral run, a campaign, or something to investigate. Under 1,000 followers, percentages are noisy and the raw count is the better guide. The engagement side of the same comparison is in Instagram engagement rate benchmarks.
How to see your own growth rate in Instagram Insights
Instagram shows follower history only to the account owner. Its help page on insights now says insights are available to public accounts (for years they were limited to professional accounts, still the safe assumption on older app versions), and describes a Total followers section that shows “growth (number of followers you’ve gained or lost)” once you have at least 100 followers, along with top locations, age range and active times, for a preset or custom timeframe within the past 90 days.
The steps in the app, as of late 2026 (Instagram moves these menus often, so labels may differ):
- Open your profile and tap Professional dashboard (or Insights, depending on your version).
- Tap Total followers or New followers in the overview.
- Use the dropdown at the top to set the timeframe: Last 7 days, Last 30 days, Previous month, or a custom range within 90 days.
- Read the Growth figure: the number of followers gained or lost over the period.
- Divide it by the follower count at the start of the period and multiply by 100; Instagram shows the change, not the rate.
The 90-day window is the limit that catches most people: a series longer than three months has to be recorded by you, which is also the only method for accounts you do not own.
How to track the growth rate of any public account
Nothing on a public profile shows history: you see today’s follower count and nothing else, as Instagram follower count history explains. So a growth rate for any account you do not own starts the day you start recording it.
The method is a log with one row per account per week:
- Pick a fixed day and time. Monday morning works; the point is that every interval is seven days.
- Open each public profile on instagram.com and write down the follower count; for counts shown as “12.4K,” the exact figure usually appears on the website when you hover over the count.
- Add a column for net change (this week minus last week) and one for weekly growth rate (net change divided by last week’s count, times 100).
- After four weeks, add a four-week average. One good week is noise; four weeks above the usual rate is a change.
- Next to growth, record posts that week, average likes and average comments. Growth with flat engagement is the first sign that the followers are not real.
Ten accounts take about five minutes a week; the full spreadsheet, with charts, is in Instagram follower growth tracker. To compare with the monthly benchmarks, use the count on the first log day of each month rather than adding four weekly rates.
If logging by hand is the step that fails, a weekly recap does the recording for you. Followcap is our product, so read this as the maker’s description. You type the usernames of public Instagram creator or business accounts, with no Instagram login or password needed, and every Sunday one email arrives with a 30-second summary, the three posts not to miss, a two to three line recap of the best posts from each account with their links, and “what you can apply this week.” Three accounts are free with no card. Premium (€9 a month, 10 accounts) adds the weekly numbers per account, including follower growth alongside posts, likes, comments and best post, and a personal archive page; Business Pro (€29 a month, 50 accounts, 3 team users) adds a dashboard with alerts, CSV export and a “you vs your niche” view. The limits: it is weekly, not real time; public creator and business accounts only; it sees public posts, likes, comments and follower counts, so no reach, saves, views, watch time, mentions, Stories or audience data; and paid plans are paid after the 7-day trial, with a 30-day money-back.
Healthy growth and suspicious growth, by the shape of the curve
Once you have twelve weeks of counts, plot them. The shape tells you more than any single rate.
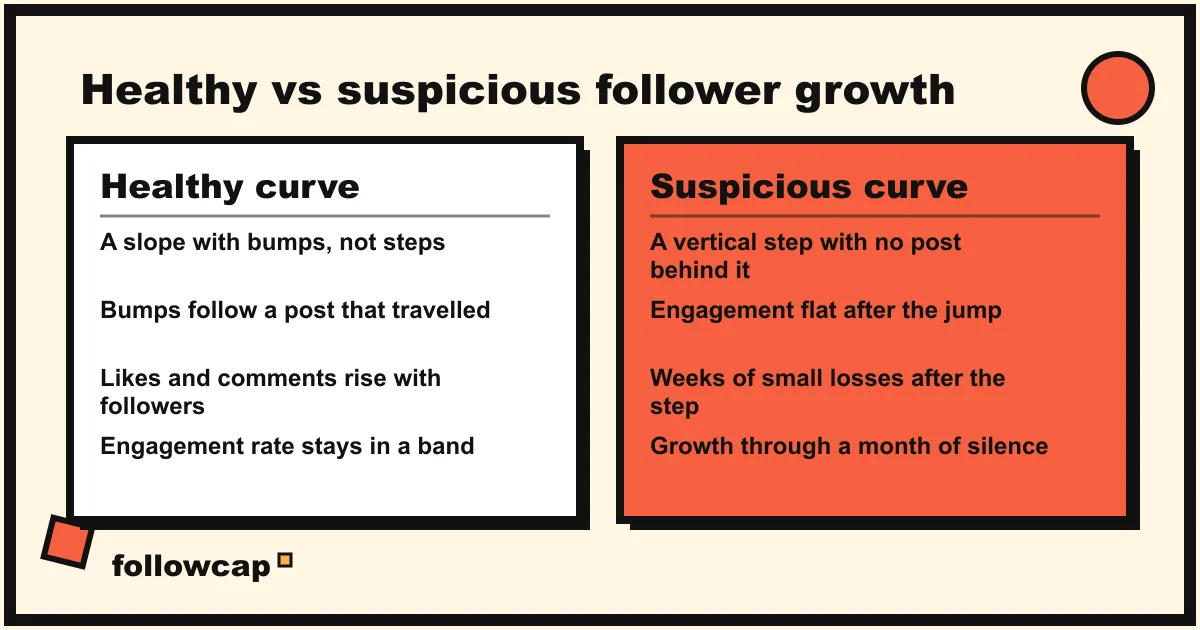
A healthy curve is a slope with bumps. The weekly rate wobbles around its average, a good Reel adds a bump that fades over two or three weeks, growth is higher in weeks with more posts, and likes and comments rise roughly in step with followers, so the engagement rate stays in a band.
A suspicious curve is a staircase. The signs, from the public numbers only:
- A vertical step with no post behind it. Thousands of followers in a day while the week’s posts did nothing unusual. A viral Reel shows up in its view count, a giveaway in the caption; a bought batch shows up as nothing.
- Engagement that does not move. The account doubled and the average post still gets the same 300 likes, so the engagement rate (likes plus comments divided by followers) collapses in one step. Instagram engagement rate shows how to compute it for any public account.
- A slow bleed after the step. Instagram said in its 2018 announcement on reducing inauthentic activity that it would begin “removing inauthentic likes, follows and comments from accounts that use third-party apps,” and accounts that bought followers tend to show weeks of small losses after a jump. Organic followers do not leave in a steady trickle.
- Growth with no posts at all. An account that gains steadily through a month of silence is riding an old viral post or buying.
One caveat. Collaborations, features and giveaways also make steps, and they are legitimate, so check the week’s posts and tagged accounts before judging. One sign is a question; three together, with no post to explain them, is an answer. The manual checks that go with the curve are in how to spot fake followers on Instagram.
A negative month is not automatically a problem either. A clean-up of inauthentic accounts, a post that upset part of the audience or a long gap in posting produce the same sign; the useful question is whether likes per post fell with the followers.
FAQ
What is a good growth rate for an Instagram account?
For an established account of 1,000 to 1 million followers, about 1 to 2 percent a month is typical in Socialinsider’s 2025 brand data, with smaller accounts at the higher end. Two to three percent a month sustained over a quarter is strong; above 5 percent usually means a viral run or a campaign rather than a new normal.
How do I calculate my Instagram follower growth rate?
Take the follower count at the end of the period, subtract the count at the start, divide by the count at the start and multiply by 100. From 4,000 to 4,090 in a month is (4,090 − 4,000) ÷ 4,000 × 100 = 2.25 percent.
How many followers should I gain per month?
It depends on your size, which is why the rate exists. At 2,000 followers, the 2025 average of about 1.7 percent a month is 34 new followers. At 50,000, the bracket average of about 1.1 percent is roughly 550.
Can I see another account’s follower growth rate?
Only by recording it. A public profile shows the current follower count and no history, so you log the count weekly, or use a service that records it for you, and the series starts the day you begin.
Why is my growth rate lower than the benchmark?
In Socialinsider’s data the average halved between 2024 and 2025, so a rate that looked slow in 2024 is ordinary now. Check the period (a 30-day rate against a yearly benchmark is a mismatch) and compare with three or four accounts of your size in your niche. If the count is falling, why am I losing followers on Instagram works through the causes in order.
Related reading
- How Often Do Brands Post on Instagram? Posting Frequency Benchmarks (2026)
- The Best Instagram Analytics Tools in 2026 (Yours and Others’)
- 8 Best Instagram Monitoring Tools in 2026 (Creators and Brands)
The bottom line
The Instagram follower growth rate is net new followers divided by the starting count, times 100, per month. Socialinsider’s 2025 benchmarks put a typical brand account at 11 to 22 percent for the year, so about 1 to 2 percent a month is normal, 2 to 3 is strong, and a sudden step with flat engagement is a warning. Your own rate lives in Insights, for the last 90 days only; anyone else’s lives in a log you keep, or in a weekly recap such as Followcap, which we make and which records the follower trend of public creator and business accounts every Sunday, weekly rather than live.