Instagram Follower Growth Tracker: How to Track the Growth of Any Account
Track the follower growth of any public Instagram account: a weekly log, the growth rate formula, healthy ranges by size, and how to spot bought followers.
 Andrea Marino9 min read
Follower count is the most visible number on Instagram and the least useful on its own. Follower growth, recorded week after week, tells you whether an account is winning, stalling or buying its way up. You can track it for any public account with a spreadsheet and two minutes a week. This guide gives you the log, the formula, growth ranges by account size from published benchmarks, and the curve shapes that give away bought followers.
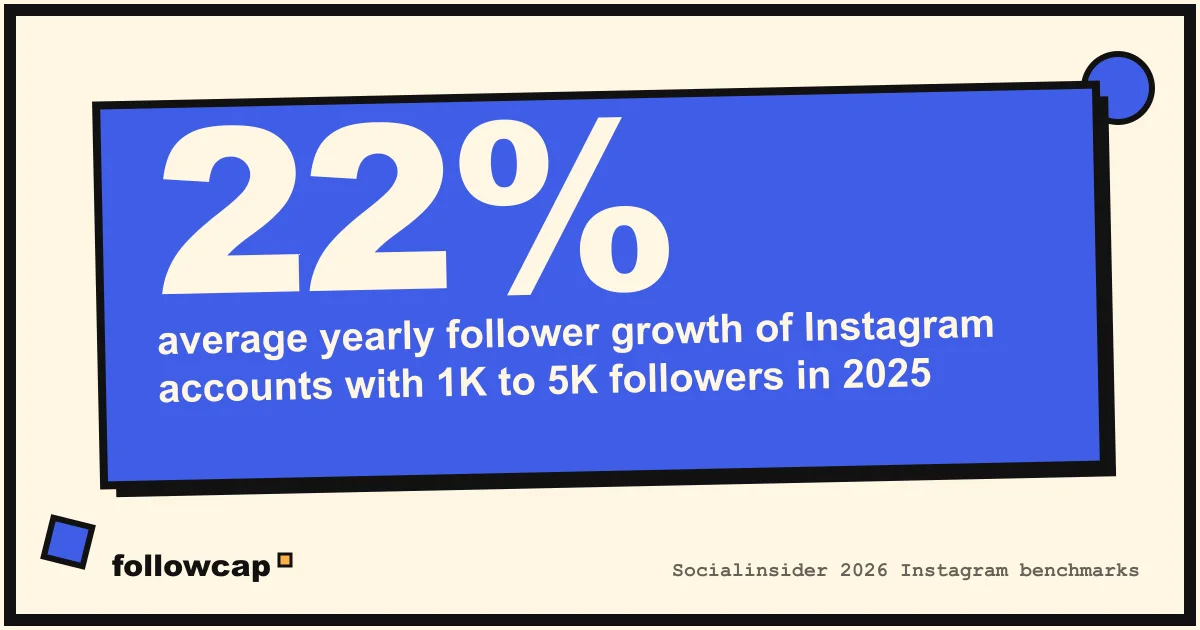
Quick answer: record the follower count of each account you track on the same day every week. Weekly growth rate is net new followers divided by followers at the start of the week, times 100. Socialinsider’s 2026 Instagram benchmarks, built on 2025 data from professional accounts, put yearly audience growth at roughly 22 percent for accounts with 1K to 5K followers and about 11 percent for accounts with 100K to 1M, which works out to roughly 0.2 to 0.4 percent a week on average. Organic growth is a slope; bought growth is a step.
Why track follower growth instead of follower count?
A follower count is a stock. Growth is a flow, and flows carry the information. An account gaining 400 a week, up from 150 a month ago, tells you something changed, and your job is to find out what.
Growth is also the public number that summarises everything else. Likes and comments tell you how the existing audience reacts; growth tells you whether new people are arriving.
The catch is that Instagram shows no public follower history. You see today’s count and nothing else. So the tracker has to be yours, and the series starts the day you start recording.
The follower growth rate formula
It is the same formula benchmark reports use.
Growth rate = (followers at end − followers at start) ÷ followers at start × 100
Worked example, weekly: an account has 10,000 followers on Monday and 10,150 the following Monday. Net new followers are 150. 150 ÷ 10,000 × 100 = 1.5 percent for the week.
Three rules keep the number honest.
- Always divide by the starting count. Dividing by the end count flatters fast growers and shrinks losses.
- Compare equal periods only. To set a weekly rate against a yearly benchmark, divide the yearly figure by 52 for a rough equivalent, and say that you did.
- Use the rate for comparisons, the raw number for context. 1.5 percent is a strong week at 10,000 followers and a normal day at 300. Keep both columns.
What does healthy follower growth look like?
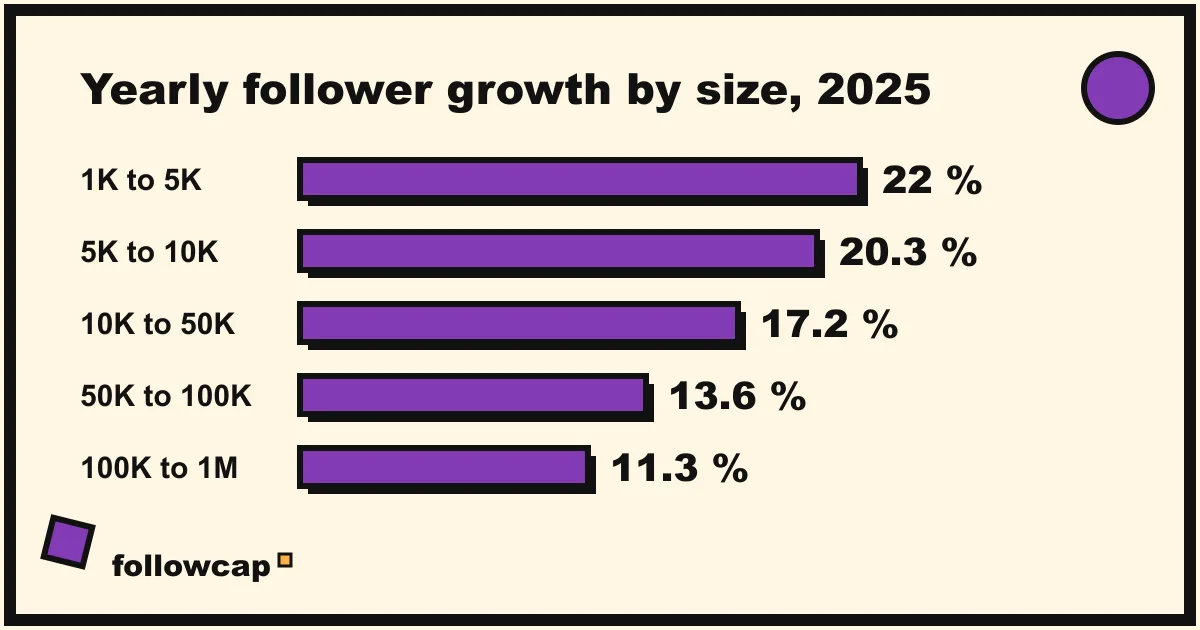
There is no official number, and most growth figures online trace back to no dataset at all. The one large, recent, published series we are confident in is Socialinsider’s 2026 Instagram benchmarks, covering about 67 million organic posts from professional accounts with 1K to 1M followers, with 2025 as the data year. Its yearly audience growth averages, rounded to one decimal:
| Account size | Average growth in 2025 | Rough weekly equivalent |
|---|---|---|
| 1K to 5K followers | 22 percent | about 0.4 percent |
| 5K to 10K | 20.3 percent | about 0.4 percent |
| 10K to 50K | 17.2 percent | about 0.3 percent |
| 50K to 100K | 13.6 percent | about 0.3 percent |
| 100K to 1M | 11.3 percent | about 0.2 percent |
The weekly column is our own division by 52, not a figure from the report; it ignores compounding and only exists to make the yearly numbers usable in a weekly log. Two things stand out. Smaller accounts grow faster in percentage terms, because each new follower is a bigger share of a small base. And growth slowed sharply: the same report shows the 1K to 5K tier at 38 percent in 2024, consistent with the slide in engagement that Socialinsider and Rival IQ both describe.
As a rough reading for a weekly log:
- Small accounts (under 10K): around 0.4 percent a week on average. A sustained 1 percent a week is excellent.
- Medium accounts (10K to 100K): around 0.3 percent a week. Half a percent, kept up for a quarter, is strong.
- Large accounts (100K to 1M): around 0.2 percent a week, usually lumpy, driven by single posts that travel.
Treat these as context, not targets. The useful comparison is an account against its own last twelve weeks, and against 5 to 10 accounts of similar size in the same niche, the method in Instagram competitor analysis.
How to build a follower growth tracker in a spreadsheet
Any spreadsheet works; Google Sheets is handy because it opens on your phone while you check profiles.
One tab, one row per account per week. Columns: date, account, followers, net change, weekly growth rate, four-week average growth, posts this week, average likes, average comments, note.
- Net change is this week’s followers minus last week’s.
- Weekly growth rate is net change divided by last week’s followers, times 100. In Sheets, with last week’s count in C2 and this week’s in C3:
=(C3-C2)/C2*100. - Four-week average smooths the noise. One good week means little; four weeks above the usual rate means something changed.
- Posts, likes and comments sit next to growth on purpose. Growth with flat engagement is the first sign of trouble.
Two charts. A line chart of followers per account shows the shape of the curve, which you read for bought followers. A chart of weekly growth rate shows acceleration, which you read for strategy changes.
Record on the same day each week. Monday morning works for us. A Monday row compared with a Thursday row is a ten-day period pretending to be a week. After eight weeks you can see trends; after twelve you can tell a campaign from a one-off.
How to spot bought followers from the shape of the curve
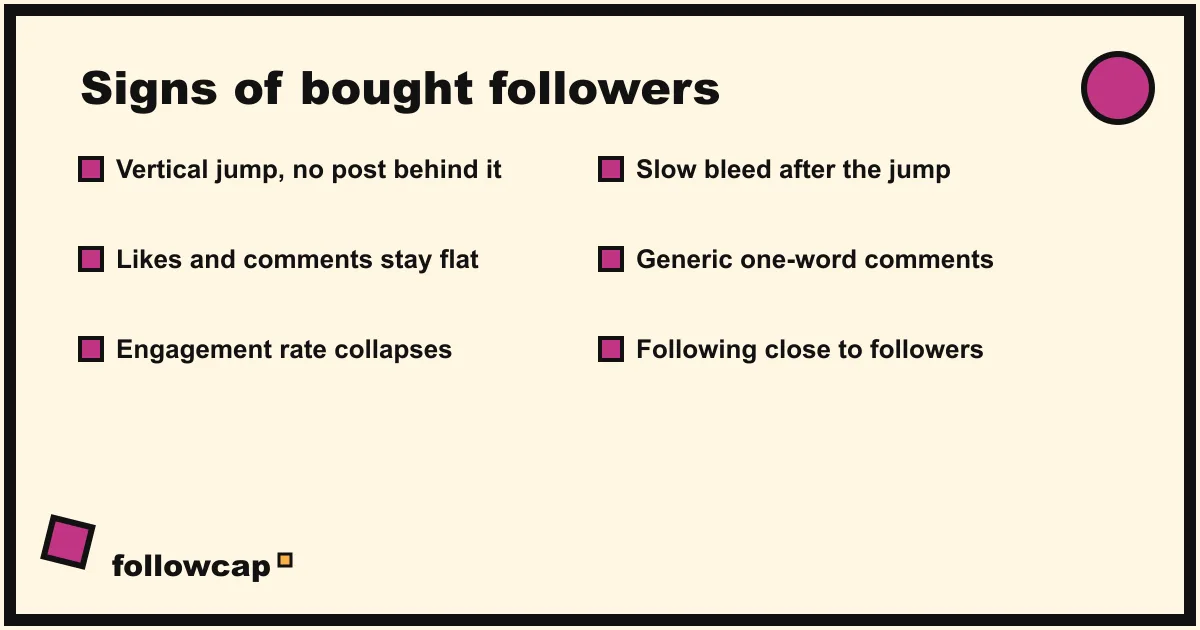
You cannot see who follows an account, but you can see what organic growth looks like, and bought growth looks different. Organic growth is a slope with bumps. Bought growth is a staircase. The signs, from the public numbers only:
- A vertical jump with no post behind it. Thousands of followers in a day, and the week’s posts did nothing unusual. A viral reel shows up in the view count, a giveaway or press feature in the caption. A paid batch shows up as nothing.
- Likes and comments stay flat. The account doubled and the average post still gets the same 200 likes. Bought followers do not engage.
- Engagement rate collapses after the jump. The same sign as a ratio. An account that went from 2 percent to 0.4 percent across one jump changed its denominator, not its content. The method is in Instagram engagement rate: formula, benchmarks, how to check.
- A slow bleed after the jump. Fake and inactive accounts get removed over time, so a bought batch is followed by weeks of small losses. Organic followers do not leave in a steady trickle.
- Generic comments. “Nice!”, “Great post”, a string of emojis, from accounts with no posts of their own. Bought engagement is often sold with bought followers.
- Following count close to follower count. Not proof of buying, but the fingerprint of follow-for-follow, which produces the same flat engagement.
Two caveats. Giveaways, features and collaborations also produce jumps, and they are legitimate; check the posts and tagged accounts for that week first. And a promoted post can inflate views and follows at once; you cannot see from outside whether a post was an ad. One sign is a question. Three signs together, with no post to explain them, is an answer.
Which tools track Instagram follower growth?
By hand is where to start and, for most people, where to stay. Ten accounts take under five minutes a week.
Instagram Insights shows the follower trend for your own professional account, with follows and unfollows over the period; it is the only place with real history. Meta Business Suite does the same for accounts you manage. Neither shows anyone else’s history.
Social media suites such as Hootsuite, Sprout Social, Rival IQ and Socialinsider offer competitor tracking built on public follower counts, usually inside a broader paid plan. The series still starts the day you add the account.
Avoid “who unfollowed me” and follower tracking apps that ask for your Instagram password. They cannot show anything about other accounts that is not public, sharing your login is against Instagram’s terms, and the risk is your account. The reasons in full are in how to see analytics of other Instagram accounts.
A weekly recap is the middle option, and here we should be transparent: Followcap is our product, so read this as the maker’s description. You type the usernames of public Instagram creator or business accounts, with no Instagram login or password, and every Sunday one email arrives with a short summary of their week, the three posts not to miss, a recap of the best posts from each account with their links, and a note on what to apply. Three accounts are free, without a card. Premium (€9 a month or €90 a year, up to 10 accounts) adds the weekly numbers per account, including follower growth alongside posts, likes, comments and best post, with an archive page of every recap: the tracker above, filled in for you. Business Pro (€29 a month, up to 50 accounts, three team users) adds alerts on follower spikes and posting pace changes, CSV export and a monthly PDF report. The limits: it is weekly, not a live dashboard; public creator and business accounts only; it cannot show reach, saves, views, watch time or audience data, because nobody outside the account can; and it is paid after the 7-day trial, with a 30-day money-back after the first charge. For the broader landscape, see the best Instagram monitoring tools.
FAQ
How often should I record follower counts?
Once a week, on a fixed day. Daily recording adds noise without insight, except for two weeks after a viral post, when a daily row shows how long the lift lasted.
What is a good monthly follower growth rate on Instagram?
Dividing Socialinsider’s 2025 yearly averages by 12, our own arithmetic, gives roughly 1 to 2 percent a month under 50K followers and under 1 percent above 100K. Anything above that, sustained for three months, is well ahead of the typical professional account.
Can I see a competitor’s follower history from before I started tracking?
No. Instagram shows only the current count on a public profile, and no legitimate tool can recover history it did not record. Some suites have recorded large accounts for years; for smaller accounts, your log is the history.
Why would an account suddenly lose followers?
The common causes are a post that upset part of the audience, a change of niche, or a clean-up: Instagram periodically removes accounts it identifies as fake or inauthentic, and accounts with bought followers lose the most. A drop after a long flat period usually means the last one. You cannot see who unfollowed another account; the apps that claim to show it need your password.
Related reading
- Instagram Follower Growth Rate: Formula, Benchmarks and How to Track It
- Social Media Competitor Analysis Template (Free, Weekly)
- The Best Instagram Analytics Tools in 2026 (Yours and Others’)
The bottom line
A follower growth tracker is a spreadsheet with one row per account per week, a growth rate column (net new followers divided by the starting count, times 100) and a line chart. Socialinsider’s benchmarks put typical yearly growth in 2025 at roughly 22 percent for small accounts and 11 percent for large ones, so a few tenths of a percent a week is normal and 1 percent a week is excellent. Read the shape of the curve: slopes are organic, steps with flat engagement are not. Keep it by hand for the first quarter; if the logging slips, a weekly recap such as Followcap Premium, which we make, records follower growth for public accounts every Sunday, weekly rather than live.