Social Media Report Template for Clients (Weekly and Monthly)
A copy-paste social media report template for clients: a one-page weekly format, a monthly format, which numbers to include, how to write the commentary, how to send it.
 Andrea Marino9 min read
Most social media reports are built for the person writing them, not the person reading them. Forty screenshots from Instagram Insights, a chart for every metric, and a client who scrolls to the end to find out whether things went well. This template takes the opposite approach: one page a week, a short monthly review, and commentary in plain sentences. We use the same structure for our own weekly review.
Quick answer: a weekly client report is one page. Three headline numbers for the client’s own account from Instagram Insights, the week’s best post, two or three competitor lines built from public numbers, and three lines of commentary that end in one recommendation. The monthly report adds trends, what was tried, and next month’s plan. Send it as a PDF attached to a short email, same day every week.
What does a client actually read in a social media report?
The first screen. In our experience a client reads the headline numbers, looks for “up” or “down”, reads the recommendation, and skims the rest only if something worries them. That is not laziness; they pay you so they do not have to read Insights.
So the report has two jobs. The first screen answers “how did the week go and what are we doing about it” in under a minute. Everything below it is proof: the numbers behind the sentence, the posts behind the numbers. Without the proof, the client stops trusting the sentence.
One more thing clients read closely: anything about their competitors. It is also the part most reports leave out, because the data is not in Insights.
Which numbers belong in a client report?
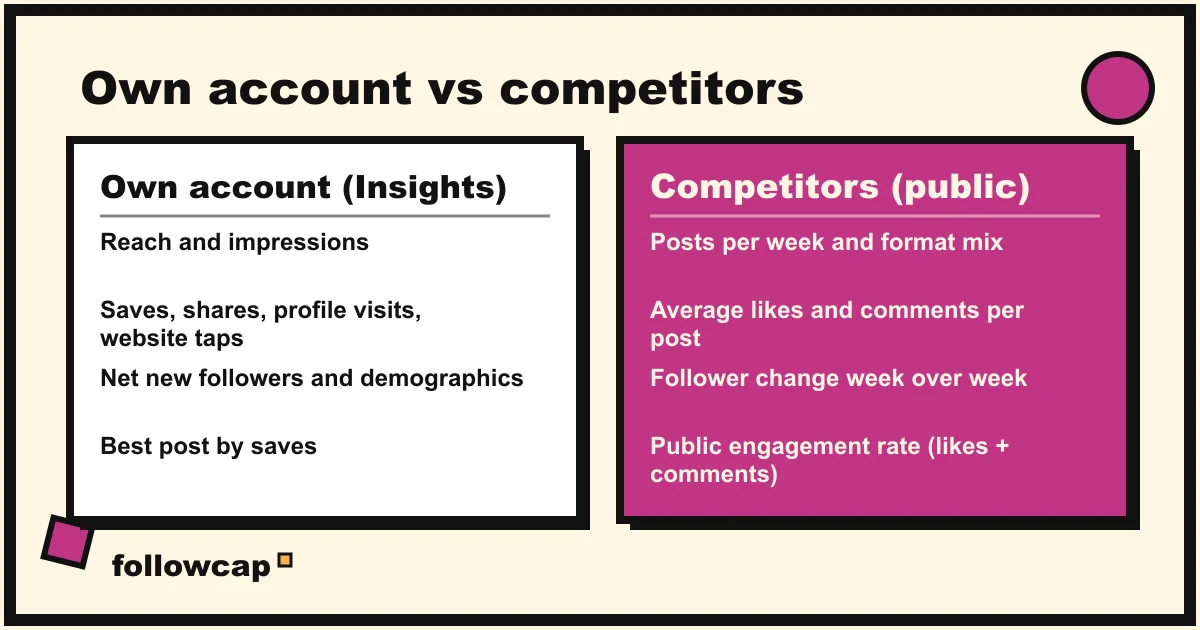
Two sources, kept apart and labelled.
The client’s own account, from Instagram Insights or Meta Business Suite. You have access, so you have the private numbers: reach, impressions, saves, shares, profile visits, website taps, demographics, and net followers gained. Pick three for the headline and keep the rest in the proof section. For most small businesses the three are reach, net new followers, and engagement (likes, comments, saves and shares added together). For a shop, website taps replace reach.
Competitors and creators, from public numbers only. You do not have their Insights, and no tool can give you numbers Instagram does not make public. What anyone can see on a public account: follower count, number of posts, likes per post where the account shows them, comments, captions and posting dates. From those you get posts per week, average likes and comments, follower change, and a public engagement rate: likes plus comments, divided by followers, times 100. Say in the report that these are public numbers and that reach and saves are not visible for other accounts. Clients respect the honesty.
For context, Rival IQ’s 2024 Social Media Industry Benchmark Report put the all-industry median Instagram engagement rate for brands at roughly 0.43 percent of followers per post, with a further dip reported in its 2025 edition, and other benchmark reports place typical rates between 1 and 3 percent, higher for small accounts and creators. Name the source, and compare the client with accounts of similar size, never with a global average. The method is in how to check the engagement rate of any Instagram account.
The weekly social media report template (one page)
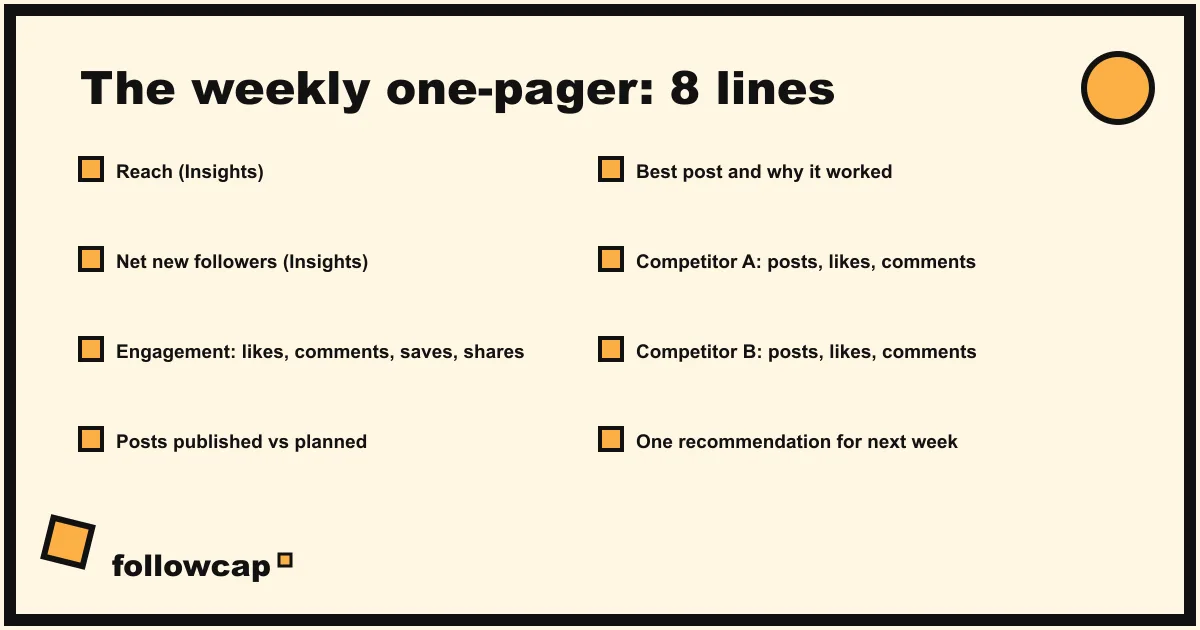
Paste this into a Google Doc and fill it in every week. Replace the bracketed text; keep the headings.
WEEKLY SOCIAL MEDIA REPORT · [Client] · Week of [Monday date]

HEADLINES
Reach: [number] ([+/- %] vs last week)
Net new followers: [number] ([+/- %] vs last week)
Engagement (likes + comments + saves + shares): [number] ([+/- %])

IN ONE LINE
[One sentence: what happened this week and why.]

BEST POST
[Link] · [format] · [reach] reach · [saves] saves
Why it worked: [one line]

POSTING
Published: [n] posts ([n] reels, [n] carousels, [n] images), [n] stories
Planned: [n] · Gap: [reason, if any]

AROUND US (public numbers)
[Competitor A]: [n] posts · avg [likes] likes / [comments] comments · followers [+/- n]
[Competitor B]: [n] posts · avg [likes] likes / [comments] comments · followers [+/- n]
[Creator C]: [n] posts · best post: [link] · [one line on what they did]

NEXT WEEK
We will: [one recommendation, with the post or change it implies]
We need from you: [one ask, or "nothing"]
Eight lines. In a spreadsheet, use the same lines as rows, with columns for this week, last week, change and source (Insights or Public). If a client asks for more, add it to the monthly report. The weekly page stays one page because that is the only way it keeps getting read.
The monthly social media report template
The monthly report is where the detail lives: four to six pages, sent in the first week of the month. It answers a different question: not “how did it go” but “is the strategy working”.
MONTHLY SOCIAL MEDIA REPORT · [Client] · [Month, year]

1. SUMMARY (half a page)
Three sentences: the result, the reason, the plan.
Headline table: reach, followers, engagement, website taps, each with
month-over-month and the same month last year if you have it.

2. TRENDS (one page)
One chart per headline number, 13 weeks on the x-axis.
One line of commentary under each chart.

3. CONTENT (one page)
Top 5 posts by saves, with links and one line each.
Bottom 3 posts, with one honest line each.
Format mix this month versus last month (reels / carousels / images).

4. AUDIENCE (half a page, Insights only)
Followers by country, age band, gender. Only the lines that changed.

5. AROUND US (one page, public numbers)
Table: 3 to 5 competitors and creators, posts per week, average likes
and comments, follower change over the month, public engagement rate.
Three things they did this month that we should learn from.

6. WHAT WE TRIED (half a page)
Each experiment: what, when, result, keep or drop.

7. NEXT MONTH (half a page)
Three priorities. The content calendar in outline. What we need
from the client, with dates.
Two rules make it worth the time. Keep the same charts every month, so the client learns to read them. And include the bottom three posts: a report that only shows winners teaches nothing and, after a few months, stops being believed.
If you run a competitor log for the client, the “around us” table comes straight from it. Our social media competitor analysis template uses the same columns, and the routine behind it is in Instagram competitor analysis.
How do you write the commentary?
The commentary is the part the client is paying for. The numbers they could get from Insights; the sentence that explains them, they cannot.
- Lead with the answer. “Reach fell 18 percent because we published two posts instead of four” beats a paragraph that arrives at the same point.
- One cause per number. If you do not know the cause, say so, and say you will watch one more week. Guessing at the algorithm costs you credibility the first time you are wrong.
- Point at posts, not metrics. “The behind-the-counter reel got 40 saves, three times our usual” is a sentence the client can act on. “Saves were up” is not.
- End with one recommendation. If you have three, pick the one you would do first and keep the others for the monthly report.
- Never pad a bad week. Clients forgive bad weeks; they do not forgive finding out later.
How should you deliver a client report?
Format: a PDF, for both reports. It looks the same on a phone and does not invite edits. Keep a shared Google Sheet as the running source of truth for clients who want to dig.
Channel: email, with the PDF attached and the three headline numbers plus the recommendation pasted in the body. Many clients never open the attachment, so the body must stand on its own.
Timing: the same day and hour every week. Monday morning works well because the recommendation can still shape the week.
Collecting the numbers: Insights and Meta Business Suite cover the client’s own account. For competitor and creator numbers you either log them by hand from the public profiles, or use a tool. The management suites (Hootsuite, Sprout Social, Rival IQ, Socialinsider) include competitor reporting at agency prices. Here we have to be transparent: Followcap is our product, so read this as the maker’s description. You type the usernames of the public creator or business accounts the client cares about, with no Instagram login, and every Sunday one email arrives with each account’s week: a short summary, the three posts not to miss and a recap of the best posts from each account with their links. Premium (€9 a month, up to 10 accounts) adds weekly numbers per account: posts, likes, comments, best post and follower growth, which map to the “around us” lines above. Business Pro (€29 a month, up to 50 accounts, three team users) adds CSV export, a monthly PDF report and alerts on spikes. The limits: it is weekly, not a live dashboard; public creator and business accounts only; it cannot show reach, saves, views, watch time or audience data for any account, because nobody outside the account can; and it is paid after the 7-day trial. If the competitor lines are what you keep skipping, start a trial with one client’s list. A broader comparison is in the best Instagram monitoring tools.
Which mistakes make a client report useless?
- Reporting everything. Twelve metrics on page one means the client reads none. Three headlines, the rest in the proof.
- Mixing private and public numbers. The client’s reach next to a competitor’s likes implies a comparison that does not exist. Label the sources.
- Changing the format. Every change resets the client’s ability to read the report at a glance. Fix the template for a quarter at least.
- No recommendation. A report that ends in numbers asks the client to decide. That is your job.
FAQ
What should a weekly social media report for a client include?
Three headline numbers from Instagram Insights (usually reach, net new followers and engagement), the best post and why it worked, what was published versus planned, two or three competitor lines from public numbers, and one recommendation. One page, same day every week.
How is a monthly report different from a weekly one?
The weekly report says how the week went. The monthly report says whether the strategy is working: 13-week trends, top and bottom posts, audience changes, a competitor table, the experiments and their results, and next month’s priorities. Four to six pages, sent in the first week of the month.
Can I include competitor data in a client report?
Yes, as long as it is public data and you say so: follower counts, posts, likes and comments, captions and posting dates. Reach, saves, shares and demographics are visible only to the account owner, and no tool can report them for another account. Label the section “public numbers”.
How do I report a bad month?
In the first sentence, with the cause and the fix. “Reach fell 22 percent; we posted half as often during the launch crunch, and the calendar is back to four posts a week from Monday.” Clients remember how you handled it longer than the number.
Related reading
- Social Media Reporting Tools: 9 Options for Clients and Teams (2026)
- Social Media Metrics to Track in 2026 (and the Ones to Ignore)
- The Best Instagram Analytics Tools in 2026 (Yours and Others’)
The bottom line
A client report is one page a week and a short review a month, not a dashboard in a PDF. Three headline numbers from Insights, the best post, a few public lines about competitors with their source named, and one recommendation. Keep the format fixed, send it the same day every week, and put the bad news first. For the competitor lines, log the public numbers by hand or let a weekly recap such as Followcap Premium or Business Pro, which we make, collect them, with the trade-off that it is weekly and public accounts only. The commentary stays yours. That is the part the client is paying for.