Social Media Metrics to Track in 2026 (and the Ones to Ignore)
Social media metrics to track by goal, with definitions, where each lives, vanity vs useful, sourced 2026 benchmarks, and what you can track for any public account.
 Andrea Marino12 min read
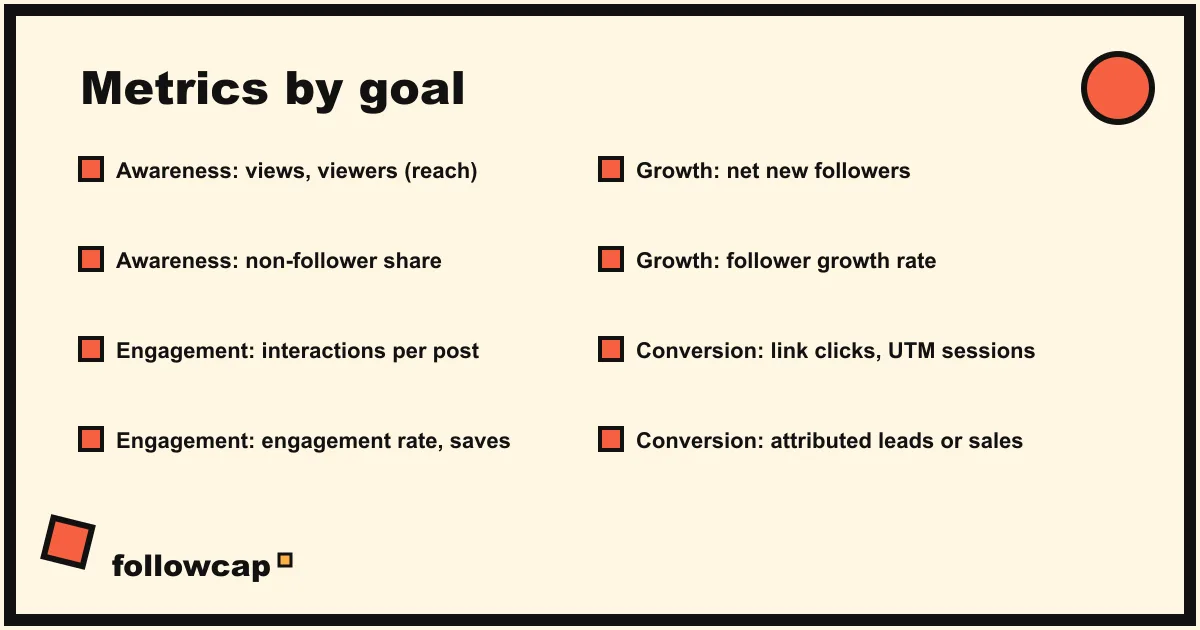
The social media metrics to track depend on the goal of the account, not on what the dashboard shows first. Awareness needs reach and views, engagement needs interactions per post and saves, growth needs net followers and growth rate, conversion needs clicks and attributed sales. Everything else is context or noise.
Quick answer: pick one goal per account, track the three or four metrics that belong to it (listed below), read them weekly against the same period last month, and ignore totals with no denominator. For accounts you do not own, the trackable set is smaller but still enough for a weekly review: posts per week, likes and comments per post, follower trend and the best post.
Start from the goal, not the dashboard
Instagram’s Insights overview opens on Views, Interactions, New followers and Content you shared. Those four are a reasonable starting screen, but they are Instagram’s choice, not yours. The guides that rank for this query list 16, 25 or 31 metrics, and nobody reviews 25 numbers weekly, so the list becomes a monthly screenshot.
The fix is to attach every metric to one of four goals, then keep the shortest list that can tell you whether that goal moved.
| Goal | Track these | Read them as |
|---|---|---|
| Awareness | Views, viewers (reach), views from non-followers, share of voice | How many people saw us, and how many were new |
| Engagement | Interactions per post, engagement rate, saves, shares (sends) | Did the people who saw it care |
| Growth | Net new followers, follower growth rate, follows per post | Is the audience compounding |
| Conversion | Link clicks, UTM sessions, leads or sales attributed to social, cost per result for paid | Did any of it turn into business |
A brand account usually has one primary goal and one secondary. A creator selling a course tracks growth and conversion; a magazine tracks awareness and engagement. Two goals, six to eight metrics, is the sustainable size.
The metrics that matter, one line each, and where they live
Definitions change by platform, and Instagram’s changed most in 2024 and 2025 when it moved to Views as the primary metric. The lines below use Instagram’s current names from its About Instagram insights page, with the equivalent on other platforms where it differs.
Awareness
- Views. The number of times your content was played or displayed, across Reels, posts, Stories, Lives and ads. The old Impressions, roughly. Lives in Insights, per post and per period.
- Viewers (reach). Unique accounts that saw your content at least once, with top countries, cities, age ranges and gender once you pass 100 viewers in the period. Insights only.
- Non-follower share of viewers. The part of your reach that was not already following you. The honest measure of discovery. Insights, per post.
- Share of voice. Your mentions as a share of mentions of you plus named competitors. Needs a listening tool; social listening vs social monitoring explains which kind.
Engagement
- Interactions. Likes, comments, saves and shares on a piece of content, as Instagram defines it. Insights, per post; likes and comments are also public.
- Engagement rate. Interactions ÷ a denominator × 100. By followers is the comparable version across accounts; by reach is the fairer version for your own content. State which one you use. Instagram engagement rate has the variants and when each misleads.
- Saves and shares (sends). The two interactions that cost the viewer something. Saves say “I will come back”; shares say “someone else should see this”. Owner’s Insights only; neither is public.
- Watch time and completion rate. For video: average seconds watched and the share that reached the end. Insights on Reels.
Growth
- Net new followers. Follows minus unfollows for the period. Insights shows it under Total followers as Growth; the public follower count gives you the same thing if you log it weekly.
- Follower growth rate. Net new followers ÷ followers at the start of the period × 100. The only growth number that compares a 2,000-follower account with a 200,000 one. Instagram follower growth rate has the formula, examples and benchmarks.
- Follows per post. How many people followed after seeing a specific post. Insights, per post, under Profile activity. The best single signal of which content recruits.
Conversion
- Link clicks and profile activity. Taps on the bio link, website button and other profile actions. Insights, per period and per post.
- UTM sessions. Visits that arrived with your tagged links. Google’s URL builder guidance says to always set utm_source, utm_medium and utm_campaign, and the values then appear in the Traffic acquisition report under source, medium and campaign. This is the only conversion metric that lives entirely outside the social platform, which is why it is the one to trust.
- Leads or sales attributed to social. Form fills, sign-ups or orders whose session started on social, from your analytics or your shop’s attribution.
- Cost per result (paid). Spend ÷ the result you optimised for. Ads Manager only.
Where these live, in one line: your own Instagram metrics are in Insights in the app and, for any public account since Instagram opened Insights to public personal and professional accounts, on instagram.com under Dashboard, both limited to the past 90 days; Facebook and Instagram together are in Meta Business Suite; conversion metrics are in your web analytics and shop; share of voice needs a listening tool. How to see Instagram insights walks through each screen.
Vanity versus useful: the short table
A vanity metric is not a bad metric; it is a number without a denominator or a decision attached.
| Vanity version | Useful version | Why the second one is better |
|---|---|---|
| Follower count | Follower growth rate, net new followers per week | A count cannot fall when you post badly; a rate can |
| Total likes this month | Average interactions per post, engagement rate | Totals rise with volume; averages show whether each post earned attention |
| Impressions or total views | Viewers (unique), non-follower share | Repeat views by the same accounts inflate totals |
| Posts published | Posts per week against your plan, and interactions per post | Output is an input, not a result |
| Comments received | Comments per post, reply rate, comment quality | Fifty “nice” comments are worth one specific question |
| Link clicks | UTM sessions and conversions from those sessions | Clicks that bounce are not traffic |
| Hashtag reach | Non-follower viewers per post | The hashtag number is a feature of a tactic, not a goal |
Two rules fall out of the table. Never report a total without the per-post or per-follower version next to it. And never report a number without the same number for the previous period; a 2.1% engagement rate is a fact, “2.1%, up from 1.6%” is information.
Benchmarks: what normal looks like in 2026
Benchmarks tell you whether a number is unusual; they are not targets, and they depend on the formula and the sample, so cite the study, not the figure.
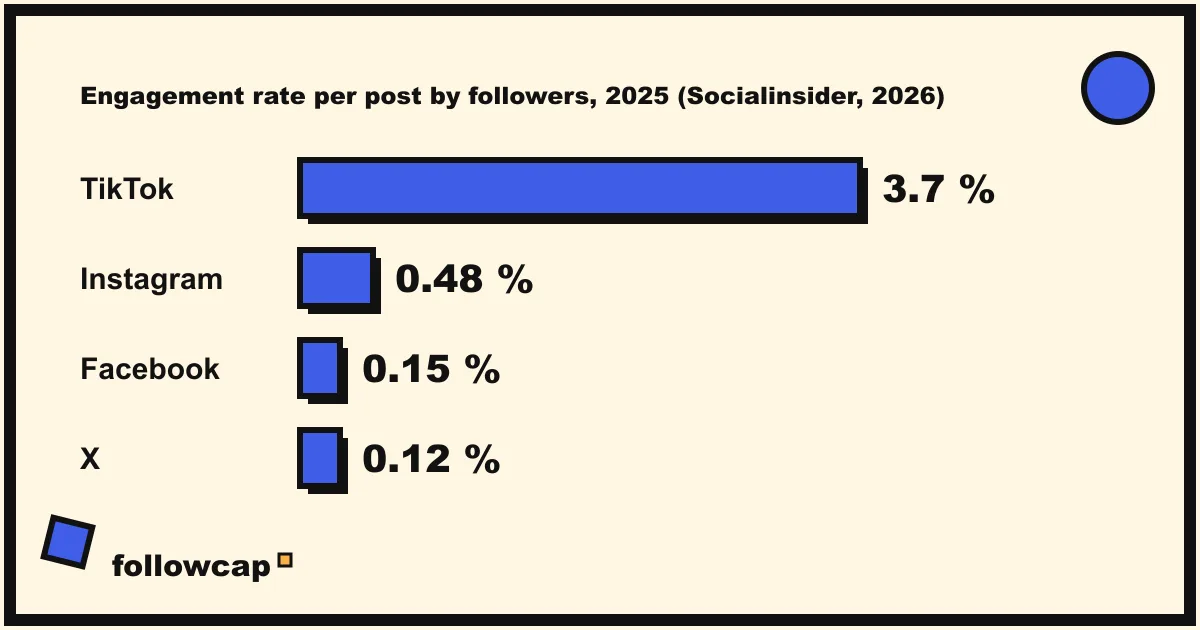
The widest recent dataset is Socialinsider’s 2026 Social Media Benchmarks, which covers 2025 posts from brand accounts and defines engagement rate per post by followers as likes plus comments on a post, divided by the profile’s followers, times 100, averaged across posts. On that definition the 2025 averages were 3.70% on TikTok, 0.48% on Instagram, 0.15% on Facebook and 0.12% on X. Instagram’s average post drew 335 likes and 20 comments, with 45 shares, and brand accounts posted about 20 times a month there.
For growth, the companion 2026 Instagram benchmarks report annual follower growth in 2025 of 22% for brand accounts with 1,000 to 5,000 followers, 17.2% for 10,000 to 50,000, and 11.25% for 100,000 to 1 million, computed as followers gained over the year divided by followers at the start.
Three cautions. These are brand accounts, and creator accounts run several times higher on engagement. Other studies use medians or divide by reach and land on different numbers, so a benchmark from one source only tells you about rates computed the same way. And the trend matters more than the level: Instagram’s average fell from 0.50% in 2024 to 0.48% in 2025, so an account flat at 0.5% held its ground. Instagram engagement rate benchmarks breaks the Instagram numbers down by industry and size.
The second set: metrics you can track for accounts you do not own
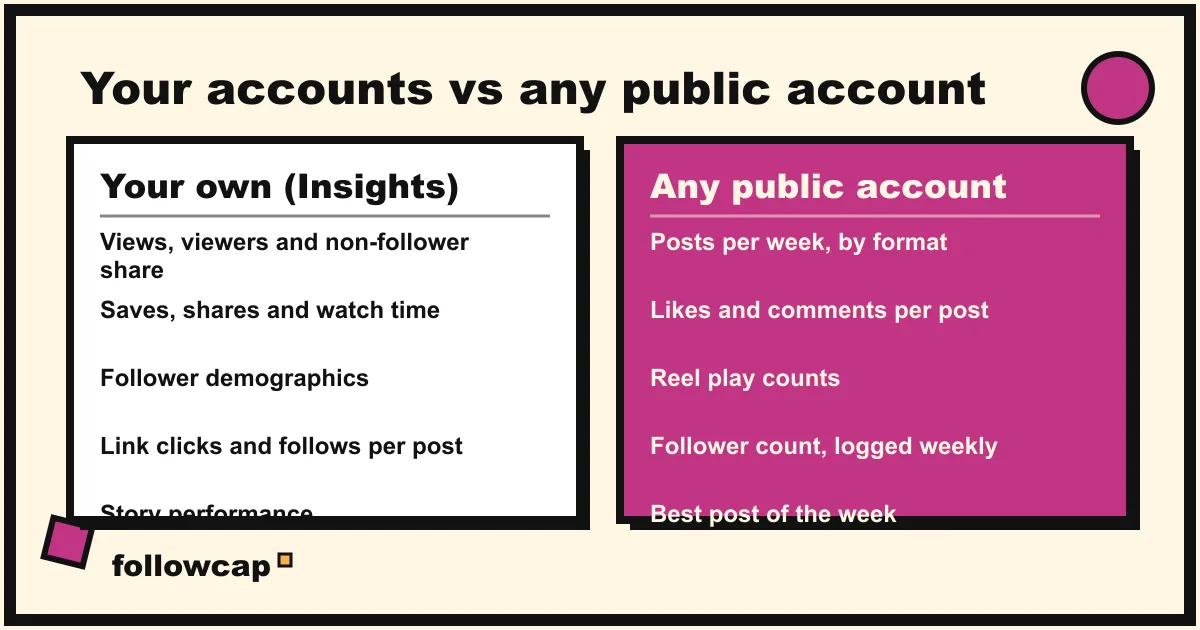
Half of the reason to track social media metrics is to compare: your account against three competitors, a client against its category, your output against the creators you learn from. For those accounts you have no Insights, so the first list collapses to what a public profile shows. The useful remainder:
| Metric | Where it comes from | What it tells you weekly |
|---|---|---|
| Posts per week, by format | The profile grid and Reels tab, dated | Whether they changed cadence or shifted to Reels |
| Likes per post | Printed under each post, unless the poster hides it | Attention per post, and which topics earn it |
| Comments per post | Printed under each post | Conversation, and the quality of the audience when you read them |
| Reel plays | Printed on each Reel | Video reach, the one reach-like number that is public |
| Follower count, logged weekly | The profile header | Net growth and growth rate, once you have two readings |
| Best post of the week | The one with the most interactions | What worked for them, which you can adapt |
| Engagement rate, by followers | Computed from the above | The comparable number across accounts of different sizes |
What you cannot track for someone else, and should not pretend to: reach, views on photo posts, saves, shares, demographics, Story performance, watch time, link clicks. Instagram reach vs views vs impressions explains why the public Reel play count is the exception.
This smaller set is enough for a weekly review because it answers the questions a review asks. Did they post more or less than usual? Which post won and why? Is their engagement per post moving up or down? Are they growing faster than us? Each one is visible from the outside and comparable across accounts.
Logging it by hand takes about 15 minutes a week for five accounts. Followcap is our product, so read this as the maker’s description: you type the usernames of public Instagram creator or business accounts, with no Instagram login or password, and every Sunday one email arrives with a 30-second summary, the three posts not to miss, a two to three line recap of the best posts from each account with their links, and “what you can apply this week”. Three accounts are free with no card. Premium (€9 a month, 10 accounts) adds exactly the table above as weekly numbers per account (posts, likes, comments, best post, follower growth) plus a personal archive page; Business Pro (€29 a month, 50 accounts, 3 team users) adds a monitoring dashboard with alerts, CSV export and a “you vs your niche” view. Its limits are the limits of public data: weekly, not real time; public creator and business accounts only; no reach, saves, views, watch time, mentions, hashtags, Stories or audience data; and paid after the 7-day trial, with a 30-day money-back.
How to review the numbers weekly without drowning
- One page per account, same layout every week. Goal at the top, the six to eight metrics for that goal, this week, last week, same week last month. The weekly social media report template is this page as a file.
- Write the comparison, not the number. “Engagement rate 1.4%, down from 1.9%, the three product posts averaged 0.6%” is a review. “1.4%” is a screenshot.
- Pick one metric to move next week. Not four. If the goal is growth, it is follows per post, and the action is making more of the post type that recruited.
- Keep the competitor set on the same page. Their posts per week, best post and follower change next to yours. The question “are we losing because we posted less or because our posts were worse” is answerable only with both.
- Monthly, check the list itself. Drop any metric that has not changed a decision in two months.
FAQ
What are the most important social media metrics to track?
For most accounts: viewers (reach) and non-follower share for awareness, interactions per post and engagement rate for engagement, net new followers and growth rate for growth, and UTM sessions and attributed conversions for business results. Pick the pair of goals that fit the account and track only their metrics weekly; the rest belongs in a monthly look.
What is a good engagement rate on social media in 2026?
On Socialinsider’s 2026 benchmarks, using likes plus comments divided by followers, the 2025 brand averages were 3.70% on TikTok, 0.48% on Instagram, 0.15% on Facebook and 0.12% on X. Smaller accounts run higher and creators run higher than brands, so compare with accounts of your size and type, measured the same way.
How often should you check social media metrics?
Weekly for the goal metrics, against the previous week and the same week last month; monthly for benchmarks, audience demographics and the list of metrics itself; daily only during a launch or a crisis.
What is the difference between a metric and a KPI?
A metric is any number you can measure, such as comments per post. A KPI is the metric you have tied to a goal and a target, such as “engagement rate above 1% on product posts this quarter”.
Can you track social media metrics for competitor accounts?
Only the public ones: posts per week, likes and comments per post, Reel plays, follower count over time, best post, and an engagement rate computed from those. Reach, saves, shares, demographics and Stories are visible to the account owner only, and any tool quoting them for a competitor is estimating. How to monitor competitors on social media covers the setup.
Related reading
- The Best Instagram Analytics Tools in 2026 (Yours and Others’)
- Instagram Audit Checklist: 25 Points to Review Your Account (2026)
- Instagram Follower Count History: How to See It (Yours and Any Account)
The bottom line
The social media metrics to track are the handful attached to your goal: views and viewers for awareness, interactions and engagement rate for engagement, net followers and growth rate for growth, UTM sessions and attributed results for conversion, each read against last week and last month, never as a bare total. For accounts you do not own, the public set, posts per week, likes, comments, Reel plays, follower trend and best post, is enough for a weekly review, logged by hand in a sheet or delivered once a week by a recap such as Followcap, which we make, for public creator and business accounts.