Instagram Reach vs Views vs Impressions: What Each Metric Means (2026)
Instagram reach vs impressions vs views: how Instagram defines each metric after the 2024 switch to Views, where they appear in Insights and which to report to a client.
 Andrea Marino11 min read
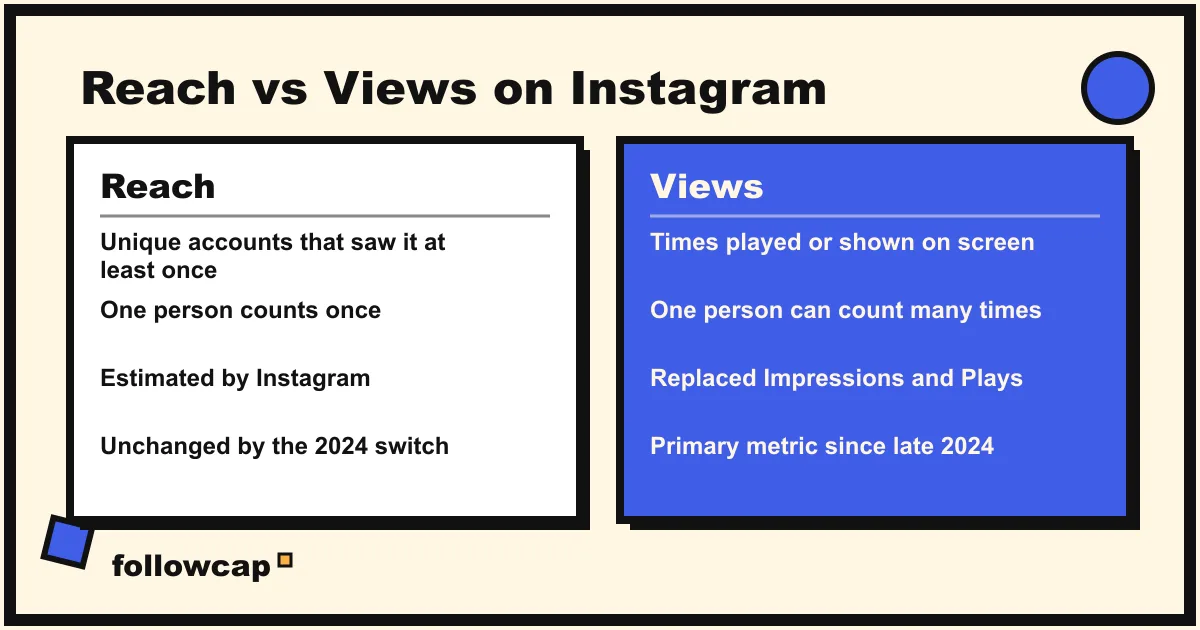
Reach is the number of unique accounts that saw your content at least once. Views is the number of times it was played or shown on screen, repeat views included. Impressions was the old name for that second number on photos, carousels and Stories; Instagram replaced it with Views between late 2024 and April 2025, and reach is the only metric that still counts people.
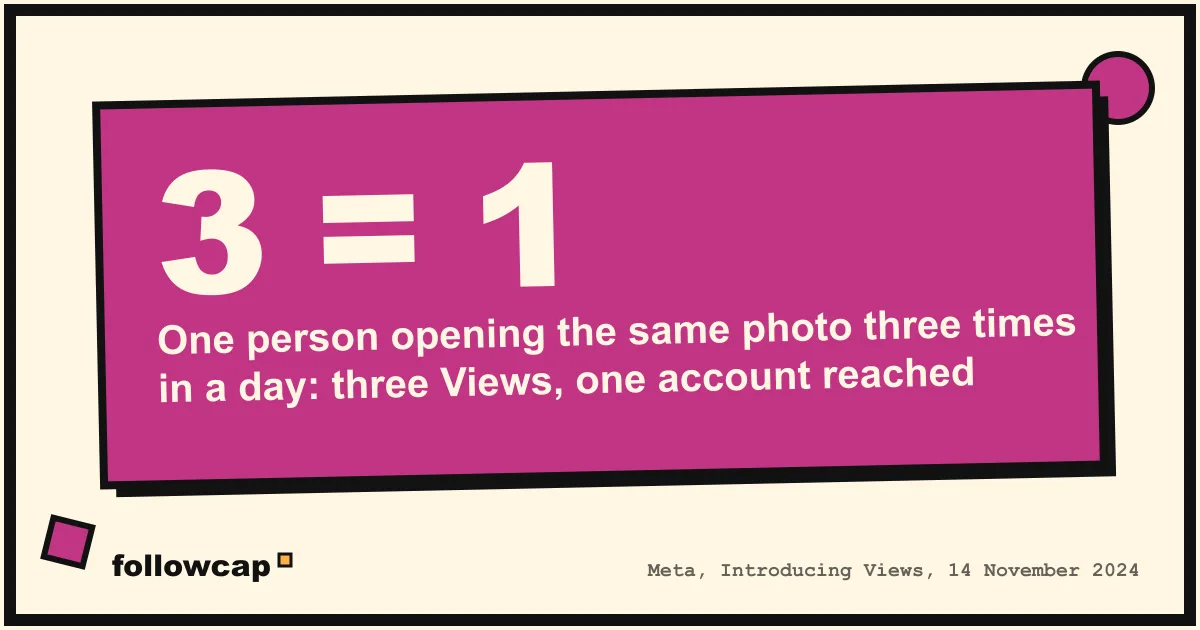
Quick answer: reach = people, views = times. One person who opens the same photo three times in a day counts as one account reached and three Views. Impressions no longer exists for content posted after mid-2024. Report reach for audience size, views for how often content is being seen, and interactions or engagement rate for whether anyone cared.
What changed: Instagram’s move to Views
For years Instagram measured photos and Reels differently. Photos and carousels reported impressions (times shown), Reels reported plays (times started), and both reported reach. Comparing a Reel with a carousel meant comparing two units.
On August 7, 2024 Instagram announced the fix: “We’re introducing ‘Views’ as the primary metric across all formats including reels, live, photos, carousels, and stories,” adding that “repeat views of content will be counted, similar to how plays and replays are counted for reels.”
Meta’s creators page of November 14, 2024, “Introducing Views to simplify content distribution metrics,” spells out the mechanics:
- Reels and videos: “Plays will now be called Views.” The calculation did not change; the separate Replays metric was removed.
- Photo and text posts and Stories: Views “are calculated as the number of times they appear on a person’s screen, including repeat views,” and Views replaces Impressions. Meta’s own example: “a person viewing a photo three separate times in the same day would count as three Views.” Because repeats are counted, Views can be higher than the Impressions you used to see.
Meta’s API v22 post of January 21, 2025 then deprecated plays, replays and impressions, with an April 21, 2025 deadline; impressions is gone for media created after July 2, 2024 and still returned for older media. That April date is why analytics tools say “impressions were replaced in April 2025,” while the app changed in the weeks after November 2024.
As of late 2026, Views is the headline number in Insights for every format, reach is still there as “Accounts reached” or “Reach,” and the word impressions survives only in old exports, old media and Ads Manager.
Reach, views, impressions, accounts engaged and interactions: definitions
The table uses Instagram’s and Meta’s own wording where it exists.
| Metric | What it counts | Repeat views by one person | Status in 2026 |
|---|---|---|---|
| Reach (Accounts reached) | Unique accounts that had your content on screen at least once | Counted once | Active, estimated |
| Views | Times a reel or video was played, or a photo, carousel or Story appeared on screen | Counted every time | Primary metric since late 2024 |
| Impressions | Times a post or Story was shown (old metric) | Counted every time | Replaced by Views; gone for content after July 2, 2024 |
| Plays | Times a Reel started or replayed (old metric) | Counted every time | Renamed Views, same calculation |
| Accounts engaged | Unique accounts that interacted (like, comment, save, share, reply) | Counted once | Active |
| Interactions | Likes, comments, saves and shares, minus unlikes, unsaves and deleted comments | Each action counted | Active |
Details that trip people up:
- Reach is estimated. Meta’s insights reference marks it as such. A reach of 10,412 means “about 10,400 accounts,” not an exact ledger.
- Reach on Reels does not require a play. Instagram’s help page says accounts reached for a Reel include accounts that saw it on screen even if it was not played. Views on a Reel do require a play start.
- Views have no minimum watch time in Instagram’s definition. The Reels count is “the number of times your reel starts to play or replay”; the photo count is times on screen. The 3-second threshold you may remember belongs to Meta’s paid video metrics in Ads Manager.
- Interactions are not accounts engaged. One person who likes, saves and comments is one account engaged and three interactions.
Why are views (and impressions) higher than reach?
Because the same person can see the same content more than once, and views count every time. Someone scrolls past your carousel in Feed, sees it again when a friend sends it, then opens it from your profile: one account reached, three views. Under the old system that was one reach and three impressions, so the logic is unchanged; only the label is.
The ratio is useful. Views ÷ reach is roughly how many times the average person who saw a post saw it. For most Feed posts it sits a little above 1. A Reel at 2.5 is being rewatched or shared; a carousel at 1.0 was seen once and scrolled past. The ratio is also why the 2024 change inflated some numbers: a Story that used to report 800 impressions may now report 1,100 views with reach unchanged at 700, because repeat opens now count.
Views can never be lower than reach for the same post and period. If you see that, you are comparing different date ranges, or a Reel’s play count with reach that includes non-players.
Where to find reach and views in Instagram Insights
Insights requires a professional account (creator or business). Switching is free and changes nothing for your followers.
For the whole account:
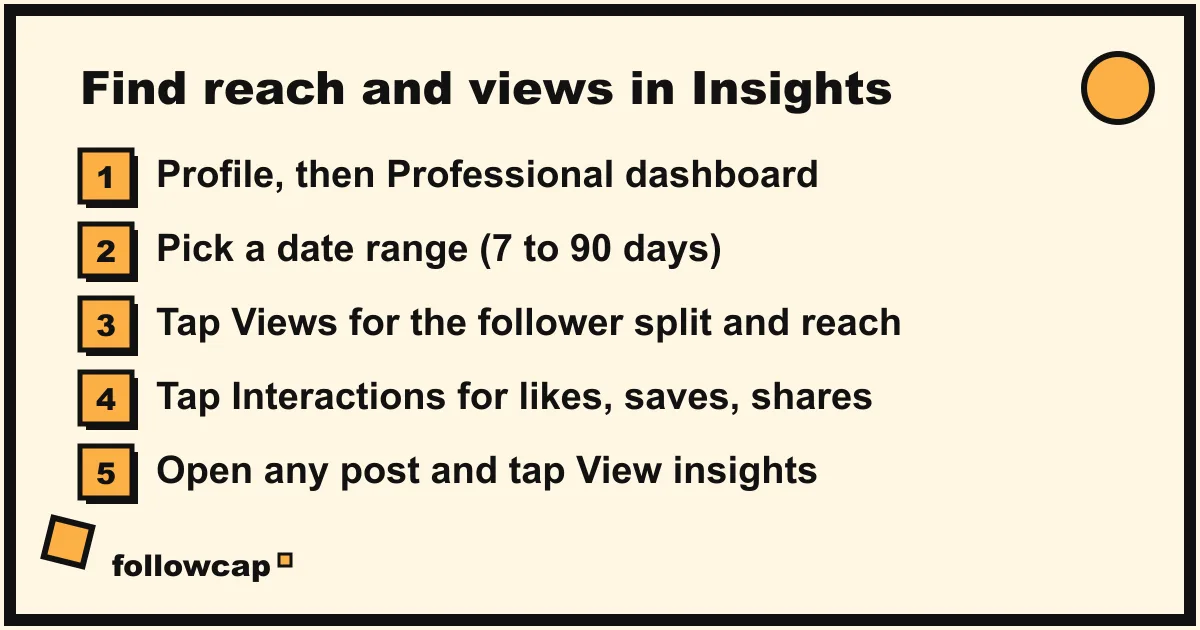
- Open your profile and tap Professional dashboard under your bio (or ☰ → Insights).
- Pick a date range: 7, 14, 30 or 90 days, or custom.
- The overview shows Views, Interactions and your follower numbers, each split between followers and non-followers. Older app versions label the first two Accounts reached and Accounts engaged, which is how Instagram’s help page still describes the overview as of late 2026; the sections are the same.
- Tap Views for the follower split, reach and a breakdown by content type. Tap Interactions for likes, comments, saves and shares by format.
- Content you shared lists every post, Story, Reel and Live in the range, sortable by views, reach, likes, saves and more.
For a single post or Reel: open it and tap View insights under it. You get views, reach with the follower split, interactions, profile visits and, for Reels, watch time.
For a Story: open it while it is live and tap the viewers count, then the insights icon. Story insights are kept only briefly after the Story expires, so note what you need the same day. On a computer, Meta Business Suite shows the same data with longer date ranges and CSV export.
Which metric should you report to a client?
All three answer different questions, and the mistake in most reports is using one to answer the other’s question.
- Reach answers “how many people did we get in front of?” Use it for awareness goals, for comparing campaigns, and for the follower vs non-follower split, which tells you whether content is finding new people. Report it as a number and as a share of followers.
- Views answer “how much was the content consumed?” Use it for Reels and video, where a rewatch is a signal, and for frequency (views ÷ reach). Do not present views as “people”; a client who hears “50,000 views” imagines 50,000 humans.
- Interactions and engagement rate answer “did anyone care?” Likes, comments, saves and shares divided by reach is the cleanest Instagram engagement rate for a post. Dividing by impressions no longer works for new content, because the metric is gone; dividing by followers ignores non-follower reach. Typical ranges by account size are in Instagram engagement rate benchmarks.
A sensible monthly line-up is reach (total and non-follower share), views (total and per reach), interactions by type, engagement rate on reach, and follower growth. The social media report template for clients has that layout with the definitions written in.
One warning for year-on-year charts: a Views line in 2026 against an Impressions line from 2023 is not the same metric, because repeat views are now counted on photos and Stories. Label the break, or compare reach, which did not change.
Can you see the reach or views of other Instagram accounts?
Mostly no. Reach, views on photos and carousels, saves, shares, watch time and audience data are private to the owner’s Insights. The only exposure is the public play count on Reels and videos, plus public likes and comments. Any tool that claims to show another account’s reach or impressions is estimating from follower counts, which is guessing.
What you can measure for another public account is what is on its profile: posts, posting rhythm, likes, comments and follower count over time, which is enough for a useful comparison. That is the scope of Followcap, and since it is our product, read this as the maker’s description. You type the usernames of public creator or business accounts, no Instagram login needed, and every Sunday you get one email with a 30-second summary, the three posts not to miss, a two to three line recap of the best posts from each account with their links, and “what you can apply this week.” Three accounts are free with no card; Premium (€9 a month, 10 accounts) adds weekly numbers per account (posts, likes, comments, best post, follower growth) and a personal archive page; Business Pro (€29 a month, 50 accounts, 3 team users) adds a monitoring dashboard with alerts, CSV export and a “you vs your niche” comparison. The limits matter here: it only sees public posts, likes, comments and follower counts. It does not and cannot report reach, views, impressions, saves, watch time or audience data for any account, including your own; those numbers live only in Insights. It is weekly, not real time, covers public creator and business accounts only, and paid plans are paid after the 7-day trial with a 30-day money-back. For the wider picture of what is visible from outside, see how to see analytics of other Instagram accounts.
What to do if the numbers look wrong
- Views lower than reach. Different date ranges, or a Reel’s play count read against reach that includes non-players. Read both from the post’s own insights screen.
- Reach dropped, views did not. Fewer people seeing it more often: usually a post your followers rewatch or share that is no longer recommended to non-followers. Check the non-follower share, and if it has collapsed, check Account Status as described in Instagram shadowban: how to check and fix it.
- Impressions missing from an export. Expected for anything posted after July 2, 2024. Use views and note the change in the report.
- Overview reach does not match the sum of posts. Overview reach is unique accounts across all content in the period; one person who saw five posts is one account there and five in the per-post totals. Views do add up.
FAQ
What is the difference between reach and impressions on Instagram?
Reach counts unique accounts that saw your content at least once; impressions counted every time it was shown, including repeats by the same account. Since late 2024 the second number is called Views on every format, and Instagram no longer reports impressions for content posted after July 2, 2024.
Are views the same as impressions on Instagram?
Close, with one change. For photos, carousels and Stories, Views replaced Impressions and now explicitly counts repeat views, so Views can be higher than the old Impressions for the same content. For Reels, Views is the old Plays count renamed, with the same calculation.
Why are my views higher than my reach?
Because one account can see the same content several times and each time adds a view, while reach counts the account once. Views divided by reach is the average number of times each person saw the post; a little above 1 is normal for Feed, higher for Reels that get rewatched.
What is a good reach on Instagram?
Instagram publishes no target, and reach depends on format, niche and whether the post was recommended to non-followers. Track reach as a share of followers per format month to month, plus the non-follower share; a falling non-follower share is the first sign to investigate.
Is reach or views more important?
Neither alone. Reach measures how many people you got in front of; views measure how much they consumed. For awareness, report reach. For video performance and frequency, report views and views per reach. For whether content worked, report interactions and engagement rate on reach.
Can I see another account’s reach or views?
Only the public play count on Reels and videos. Reach, views on photos, saves, shares and watch time are visible only in the owner’s Insights. Tools that quote another account’s reach are estimating. What you can track from outside is posts, likes, comments and follower count.
Related reading
- How to See Instagram Insights (and What Each Number Means)
- 8 Best Instagram Monitoring Tools in 2026 (Creators and Brands)
- Best Time to Post on Instagram in 2026 (and How to Find Yours)
The bottom line
Reach is people, views are times, and impressions is the old name for times on photos and Stories, retired when Instagram made Views the primary metric across every format in late 2024 and switched the API off impressions in April 2025. Report reach for audience, views for consumption and frequency, interactions and engagement rate on reach for quality, and never put a 2026 views line next to a 2023 impressions line without saying so. None of these numbers is visible for other people’s accounts beyond the public play count on video; for them, you track posts, likes, comments and followers, which is what a weekly digest like Followcap, which we make, is built around.