Weekly Social Media Report Template (Copy and Fill in 20 Minutes)
A weekly social media report template you can copy: six sections, which Instagram numbers to include and skip, a filled example, and insights that lead to a decision.
 Andrea Marino14 min read
A weekly social media report is a one-page note for the people running the account, not a client deck. It needs six sections: a headline, a small numbers table, the top three posts, the accounts you watch, what to apply, and next week’s plan. Below is a template you can copy, a filled example, and the 20-minute routine to produce it.
Quick answer: copy the Markdown template in the next section into a doc or a note, open Instagram Insights with the Last 7 days preset, fill the table with views, interactions, new followers and posts published, paste the links of your three best posts, add two or three lines on the accounts you watch, and finish with one decision for next week. Twenty minutes, same day every week.
What the weekly report is for
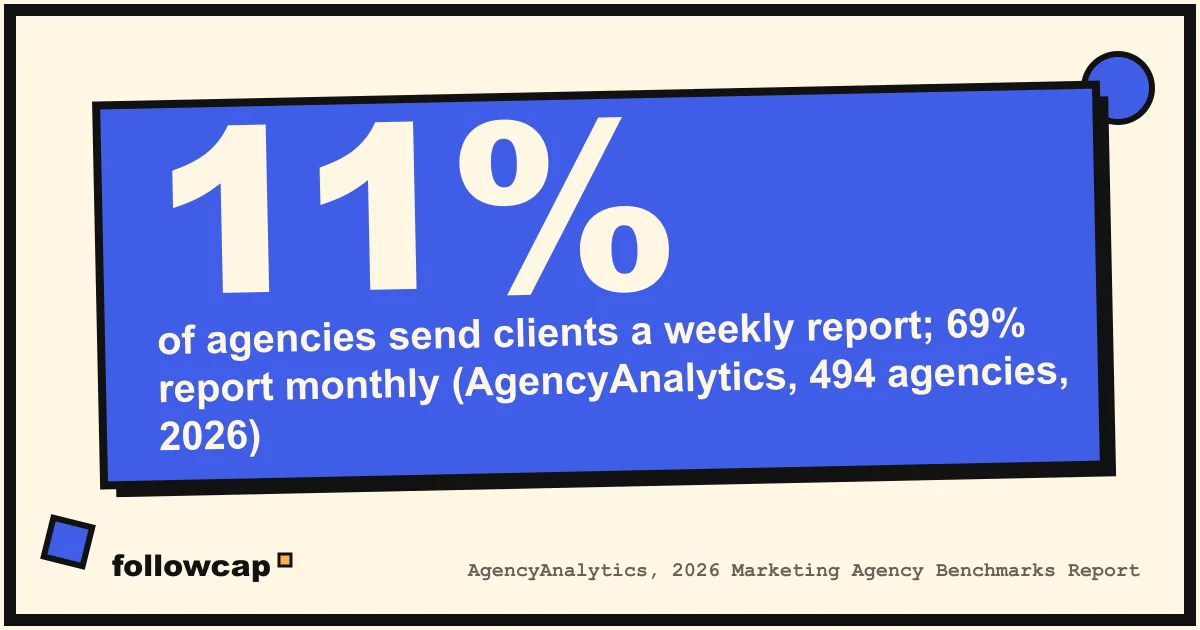
Most reporting advice is written for agencies sending monthly decks to clients. In the 2026 Marketing Agency Benchmarks Report, based on 494 agency professionals surveyed between February and April 2026, 69 percent of agencies report to clients monthly and only 11 percent weekly. That is the right cadence for a client: a month is long enough for trends to mean something.
A weekly report has a different reader and a different job. The reader is you, your team, or a manager who wants to know in two minutes whether the account is on track. The job is to catch what changed this week and decide one thing for next week: the format to repeat, the topic to drop, the creator whose idea to adapt. A report that does not end in a decision is a spreadsheet with a cover page.
That is also why it should be short. A week on Instagram is noisy. One Reel that lands in Explore can double the month’s views; one quiet week after a holiday is not a trend. So the weekly social media report compares this week with last week and the four-week average, notes the obvious cause when there is one, and leaves trend lines and conclusions about strategy to the monthly review. If you report to clients, use the one-page format in our social media report template for clients and keep this weekly one internal.
The template: six sections, one page
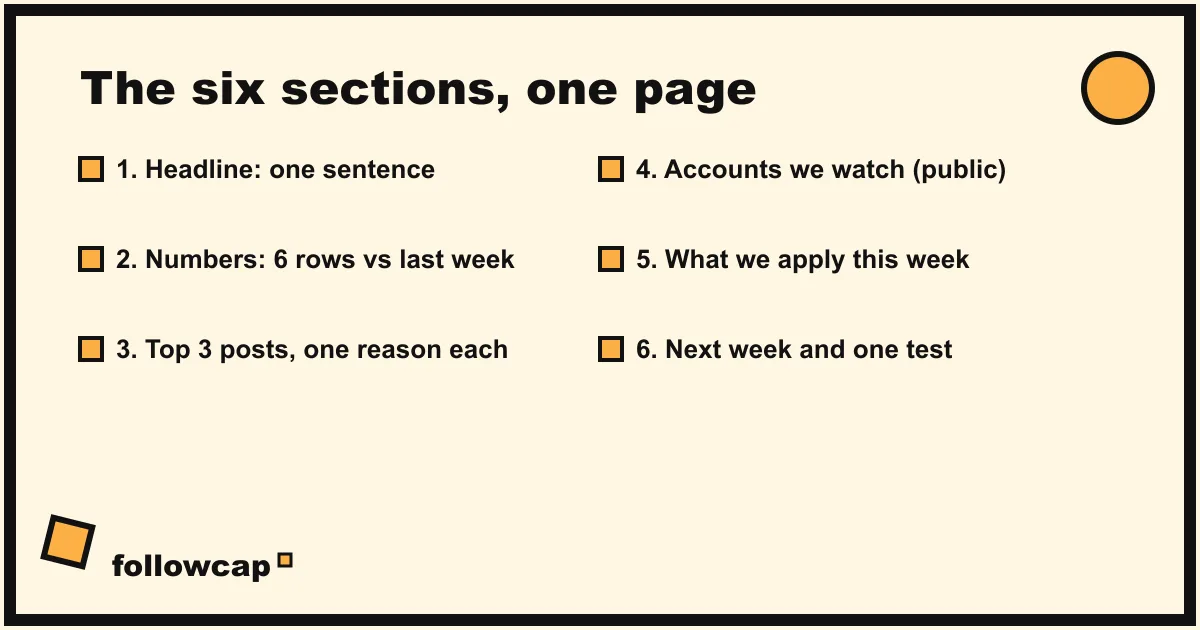
Copy the block below into Notion, Google Docs, a Markdown note or an email draft. Keep the headings, replace everything in square brackets, and delete any line you are not going to fill.
# Weekly report: [account] · week of [Mon DD] to [Sun DD]

## 1. Headline
[One sentence: how the week went and why, in plain words.]

## 2. Numbers (Instagram Insights, Last 7 days)
| Metric | This week | Last week | 4-week avg | Note |
|---|---|---|---|---|
| Posts published (feed + reels) | [n] | [n] | [n] | [formats] |
| Views | [n] | [n] | [n] | [cause if obvious] |
| Interactions (likes, comments, saves, shares) | [n] | [n] | [n] | |
| New followers (net) | [+n] | [+n] | [+n] | |
| Stories published | [n] | [n] | [n] | |
| Link taps / profile actions (if tracked) | [n] | [n] | [n] | |

## 3. Top 3 posts this week
1. [Link] · [format] · [views / interactions] · why it worked: [one line]
2. [Link] · [format] · [views / interactions] · why it worked: [one line]
3. [Link] · [format] · [views / interactions] · why it worked: [one line]
Weakest post: [link] · [one line on the likely cause]

## 4. Accounts we watch (public numbers only)
- @[account]: [posts this week], [best post + link], [what they did differently]
- @[account]: [posts this week], [best post + link], [what they did differently]
- @[account]: [posts this week], [best post + link], [what they did differently]

## 5. What we apply this week
- [One concrete change: format, hook, topic, timing, or a reply routine]
- [Optional second change]

## 6. Next week
- Planned posts: [n] · [formats and topics]
- One test: [what we try and the number that will tell us if it worked]
- Open question for the monthly review: [optional]
The numbers table is the only part that takes real time; the next section cuts it to a few minutes.
A filled example
Here is the same template filled for a small food account, so you can see the level of detail that is enough.
# Weekly report: @slowbreadclub · week of Oct 26 to Nov 1

## 1. Headline
Quiet week on views (down 18% after last week's Explore spike) but the best
follower week of the month, driven by one carousel on starter troubleshooting.

## 2. Numbers (Instagram Insights, Last 7 days)
| Metric | This week | Last week | 4-week avg | Note |
|---|---|---|---|---|
| Posts published | 4 | 5 | 4 | 2 reels, 2 carousels |
| Views | 41,200 | 50,300 | 38,900 | last week had 1 Explore reel |
| Interactions | 2,640 | 2,210 | 1,980 | saves up on the carousel |
| New followers (net) | +212 | +140 | +125 | |
| Stories published | 9 | 11 | 10 | |
| Link taps | 38 | 22 | 25 | recipe PDF link in bio |

## 3. Top 3 posts this week
1. instagram.com/p/... · carousel · 9,800 views / 1,120 interactions · why: a
   problem-first title ("Starter not rising? 5 checks") and 410 saves
2. instagram.com/reel/... · reel · 15,400 views / 620 interactions · why: a
   3-second hook showing the failed loaf before the fix
3. instagram.com/p/... · carousel · 6,100 views / 390 interactions · why:
   step list with one photo per step
Weakest post: instagram.com/reel/... · reel, 2,900 views · no hook, started
with a logo card

## 4. Accounts we watch (public numbers only)
- @sourdough.notes: 6 posts, best was a reel on scoring patterns (2,300
  likes), they posted 3 reels in a row this week, all under 20 seconds
- @bakehouse.minna: 3 posts, best was a before/after carousel; captions now
  end with a question and comments doubled on those
- @flourandsalt: 5 posts, best was a "mistakes I made" reel; they moved
  their weekly recipe post from Sunday to Thursday

## 5. What we apply this week
- Every reel opens on the problem, not on us: show the failed result in the
  first 3 seconds
- End the Thursday carousel caption with one question

## 6. Next week
- Planned posts: 4 · 2 reels (problem-first), 1 carousel, 1 photo
- One test: a 15-second reel vs our usual 40 seconds; success = view rate above
  this month's average
- Open question for the monthly review: is Thursday now our best day?
Notice what the example does not contain: no chart, no screenshot, no reach-versus-impressions discussion, no demographic breakdown.
How to fill it in 20 minutes
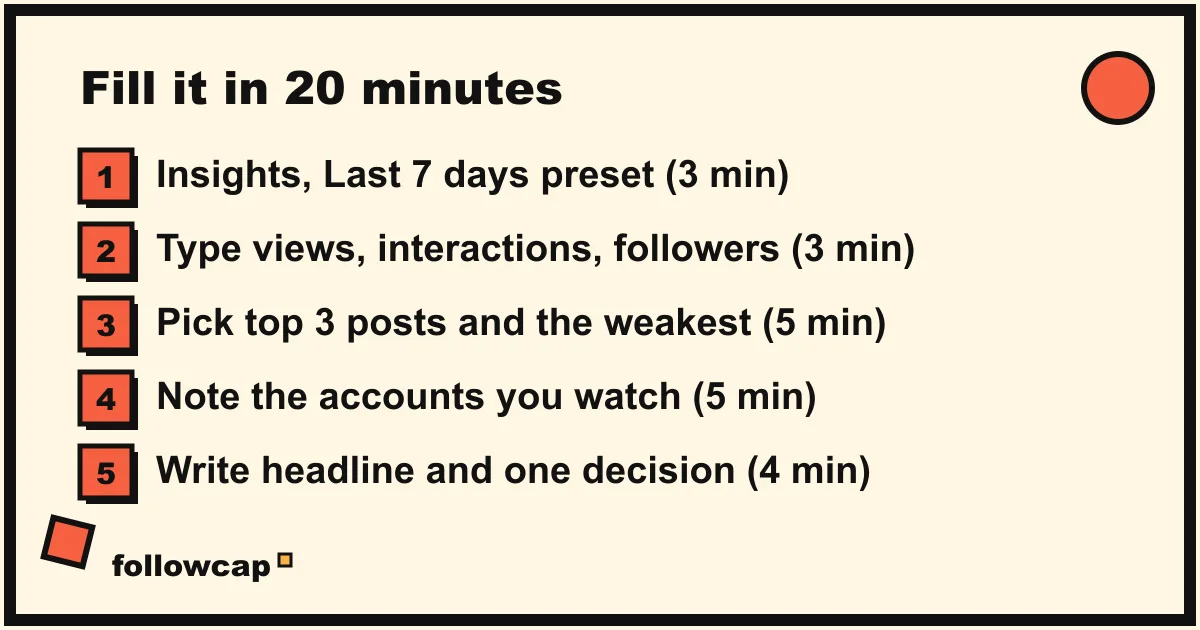
The routine below assumes a public Instagram account with access to Insights. As of late 2026, Instagram’s help page says insights are available to public personal and professional accounts, with data for any period within the past 90 days.
- Open Insights with the right preset (3 minutes). In the app, go to your profile and tap Insights, or open the Professional dashboard. On the website, choose Dashboard in the left menu, then Insights. Set the timeframe dropdown to Last 7 days. Instagram’s help page on selecting a date range for account insights lists the presets: 7, 14, 30, 60 or 90 days, or a custom range within the past 90 days.
- Copy the four overview numbers (3 minutes). Instagram’s About Instagram insights page describes the overview as Views, Interactions, New followers and Content you shared. Views are “the number of times your content was played or displayed”; interactions are likes, comments, saves and shares. Type them into the table. Do not screenshot them: a typed number can be compared next week, a screenshot cannot.
- Pick the top three posts (5 minutes). Open Content you shared in Insights, filter the content library by interactions and the last 7 days (the help page says you can filter by media type, reach, interactions and time frame), and copy the links of the top three plus the weakest one. Write one line each on why. If you cannot say why in one line, write “unclear” and move on; guessing is worse than a blank.
- Add the accounts you watch (5 minutes). Open the profiles of the three to five creators or competitors you follow for ideas and note what they posted, which post did best by likes and comments, and anything they changed. This is the section most weekly reports skip, and the one that produces most of the ideas in section 5.
- Write the headline and the decision (4 minutes). Write section 1 last, once the numbers are in front of you. Then section 5: one change you will make, phrased as an action. Finish with next week’s plan.
Two tips that save time every week. First, keep a running sheet with one row per week and the six numbers from the table; the 4-week average then takes ten seconds. Instagram only keeps the account-level window at 90 days, and exporting insights to a CSV is a paid feature of Meta One rather than something the free Insights screen offers, so your sheet is your history. Second, if you track link taps for a newsletter or a shop, tag the link in your bio with UTM parameters; Google’s page on collecting campaign data with custom URLs explains utm_source, utm_medium and utm_campaign, and the result lands in Analytics without any manual counting.
Which numbers to include and which to skip
The template leaves out most of what Insights offers, on purpose.
| Number | Weekly? | Why |
|---|---|---|
| Posts published | Yes | Explains most swings in the other rows |
| Views | Yes | Instagram’s headline metric across reels, posts and stories |
| Interactions | Yes | Likes, comments, saves and shares in one figure |
| New followers (net) | Yes | Small weekly numbers, but the direction matters |
| Stories published | Yes | A count only; story views are too volatile week to week |
| Link taps or profile actions | If you have a goal behind them | Otherwise it is a vanity row |
| Reach and viewers | Monthly | Unique accounts matter over a month, not a week |
| Audience demographics | Quarterly | They barely move week to week and need 100+ viewers to show at all |
| Best times to post | Monthly | One week of data is too thin; see best time to post on Instagram |
| Engagement rate | Monthly | Useful against benchmarks, noisy over seven days |
| Hashtag performance | Skip | Caption-level detail, not a weekly number |
The one number people most want to add is engagement rate. Keep it for the monthly review, where you can compare it with accounts of a similar size using the method in Instagram engagement rate benchmarks. On a weekly basis a single viral Reel moves it so much that the percentage says nothing about the content.
One-line insights: examples that lead to a decision
The headline, the “why it worked” lines and section 5 are where most reports go wrong, because they describe instead of explain. A good one-line insight names a cause and implies an action. Some examples from real weekly reports, anonymised:
- “Views fell 18 percent because we published four posts instead of five, not because any post underperformed.” Decision: nothing to fix.
- “Both carousels beat both reels on interactions; saves came almost entirely from the carousels.” Decision: swap one reel for a carousel next week.
- “The reel that opened on the finished product had 2,900 views; the one that opened on the mistake had 15,400.” Decision: problem first, always.
- “Comments doubled on the two captions that ended with a question.” Decision: end every caption with one.
- “Our Thursday post has been the best post of the week three weeks in a row.” Decision: move the strongest post to Thursday and watch for a month.
- “@competitor moved to three short reels a week and their likes per post rose.” Decision: test one 15-second reel.
Avoid lines like “engagement was good this week” or “we need to post more consistently.” They cannot be wrong, so they cannot be useful.
The “accounts we watch” section
Section 4 is what makes a weekly report more than a mirror. Your own numbers tell you what happened; the accounts in your niche tell you whether it happened to everyone. A 20 percent drop in views is a problem if your three closest competitors grew, and weather if they dropped too. And their best post of the week is the cheapest content research there is.
The rule is public numbers only. For any account that is not yours you can see posts, captions, dates, likes where the account shows them, comments and the follower count. You cannot see their views, reach, saves or audience, and no tool can, whatever its landing page says. How to see the analytics of other Instagram accounts sets out the line.
Doing this by hand for five accounts is the part of the 20 minutes that stretches to 40. It is also what Followcap is built for, and since it is our product, read this as the maker’s description. You type the usernames of public creator or business accounts, with no Instagram login, and every Sunday you get one email with a 30-second summary, the three posts not to miss, a two to three line recap of the best posts from each account with their links, and “what you can apply this week,” which is section 4 and half of section 5 written for you. Three accounts are free with no card; Premium (€9 a month, 10 accounts) adds weekly numbers per account (posts, likes, comments, best post, follower growth) and an archive page; Business Pro (€29 a month, 50 accounts, 3 team users) adds a dashboard with alerts, CSV export and a “you vs your niche” view. The limits: it is weekly, not real time; it covers public creator and business accounts only; it sees public posts, likes, comments and follower counts and nothing else, so no reach, saves, views, hashtags or audience data; and paid plans are paid after the 7-day trial, with a 30-day money-back. If you would rather build the section yourself, how to monitor competitors on social media has the manual routine.
Weekly versus monthly: what moves where
A clean split keeps both reports short. The weekly report holds counts and comparisons with last week: posts, views, interactions, net followers, the top three posts, the accounts you watch, one decision. It takes 20 minutes and is read in two.
The monthly report holds what needs a month to be true: reach and viewers, engagement rate against a benchmark, follower growth as a percentage, the best day and time, the format split and which format won, what you tested and whether it worked, and next month’s plan. Because the account-level Insights window is 90 days, the monthly report is also where you copy the month’s totals into your long-term sheet. Strategy questions such as how often you should post on Instagram belong to a quarterly review, not to any week.
FAQ
What should a weekly social media report include?
Six things: a one-sentence headline, a small table with posts published, views, interactions and net new followers compared with last week and the 4-week average, the top three posts with a one-line reason each, the accounts you watch and what they did, one change to apply, and next week’s plan. One page.
How long should the weekly report take?
About 20 minutes once the template is set up: three to copy the overview numbers from Insights with the Last 7 days preset, five to pick the top posts, five for the accounts you watch, and the rest for the headline and the decision. If it takes an hour, it contains monthly material.
Which Instagram metrics should I report weekly?
Views, interactions (likes, comments, saves and shares), net new followers and the number of posts and stories published. Reach, demographics, best times and engagement rate are monthly metrics: they need more than seven days of data to mean anything.
Should a weekly report go to the client?
Usually no. In AgencyAnalytics’ 2026 survey of 494 agency professionals, 69 percent of agencies report to clients monthly and 11 percent weekly. Keep the weekly report for the team and send clients a monthly one, unless a launch or a campaign is running and they have asked for weekly updates.
Can I include competitors in the weekly report?
Yes, from public numbers: posts per week, likes and comments where shown, follower count and their best post. Label them as public figures and do not estimate their reach or views, which are private to each account.
How do I keep history if Instagram Insights only shows 90 days?
Type the weekly numbers into a sheet with one row per week. Instagram’s account insights cover any period within the past 90 days, and exporting insights to a CSV is part of the paid Meta One subscription, so a sheet you fill every week is the simplest archive.
Related reading
- Social Media Metrics to Track in 2026 (and the Ones to Ignore)
- The Best Instagram Analytics Tools in 2026 (Yours and Others’)
- Instagram Audit Checklist: 25 Points to Review Your Account (2026)
The bottom line
A weekly social media report is one page, filled in 20 minutes from the Last 7 days preset in Instagram Insights: posts, views, interactions, net followers, the top three posts with a reason each, the accounts you watch, one change, next week’s plan. Keep reach, demographics and engagement rate for the monthly review, type numbers instead of pasting screenshots so you build your own history, and write insights that name a cause. The accounts-you-watch section is the one worth protecting when time is short; a weekly recap such as Followcap, which we make, can fill it from public posts, likes and comments, and the rest of the page is yours.