Social Media Benchmarking: How to Compare Your Accounts Against Competitors
Social media benchmarking step by step: five metrics with formulas, where each number comes from, 2025 and 2026 benchmarks with sources, a sheet, the mistakes to avoid.
 Andrea Marino10 min read
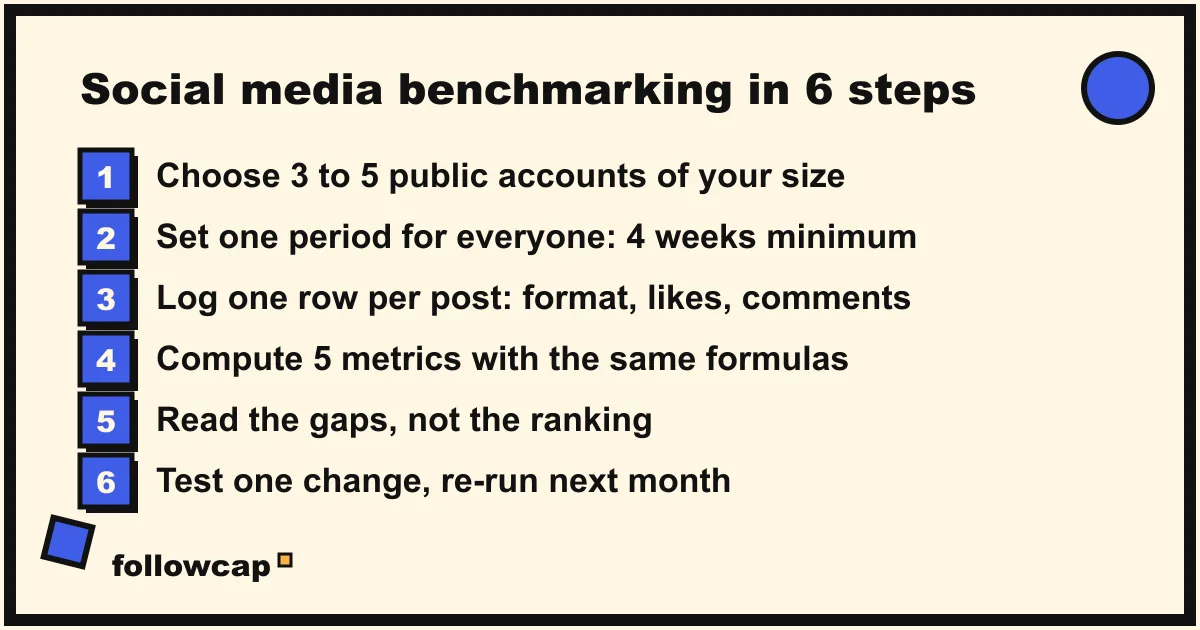
Social media benchmarking means putting your numbers next to a reference point: your own past quarter, three to five competitors, or a published industry study. Done properly it uses the same formula for every account, public data for the accounts you do not own, and at least a month of posts, so the gap you see is real.
Quick answer: pick 3 to 5 public competitor or reference accounts of a similar size. For each account and yours, log one row per post for four weeks: date, format, likes, comments, follower count. Compute five metrics with the same formulas for everyone: engagement rate per post, follower growth rate, posts per week, format mix and response time. Write down the three biggest gaps, test one change, repeat next month.
What social media benchmarking is, and the three reference points
Benchmarking turns a raw number into a judgment. “Our engagement rate is 0.6%” means nothing on its own; “0.6%, while our three rivals sit between 0.3% and 0.5% and the published average is 0.48%” tells you where you stand. There are three reference points, and a good sheet uses all of them:
- Your own history. Last month against this month. The easiest data to get, and the only fully fair comparison, because the formula, the account and the audience are the same.
- Competitors and reference accounts. Three to five public accounts your audience also follows: direct competitors, an indirect one, and one aspirational account a size band above you. The comparison that changes decisions.
- Industry studies. Averages or medians from Socialinsider, Rival IQ, Hootsuite and others. Context, not targets: each study uses a different formula and sample, as the numbers below show.
Benchmarking is the numbers part of social media competitor analysis, which also covers positioning and content themes.
The five metrics worth benchmarking
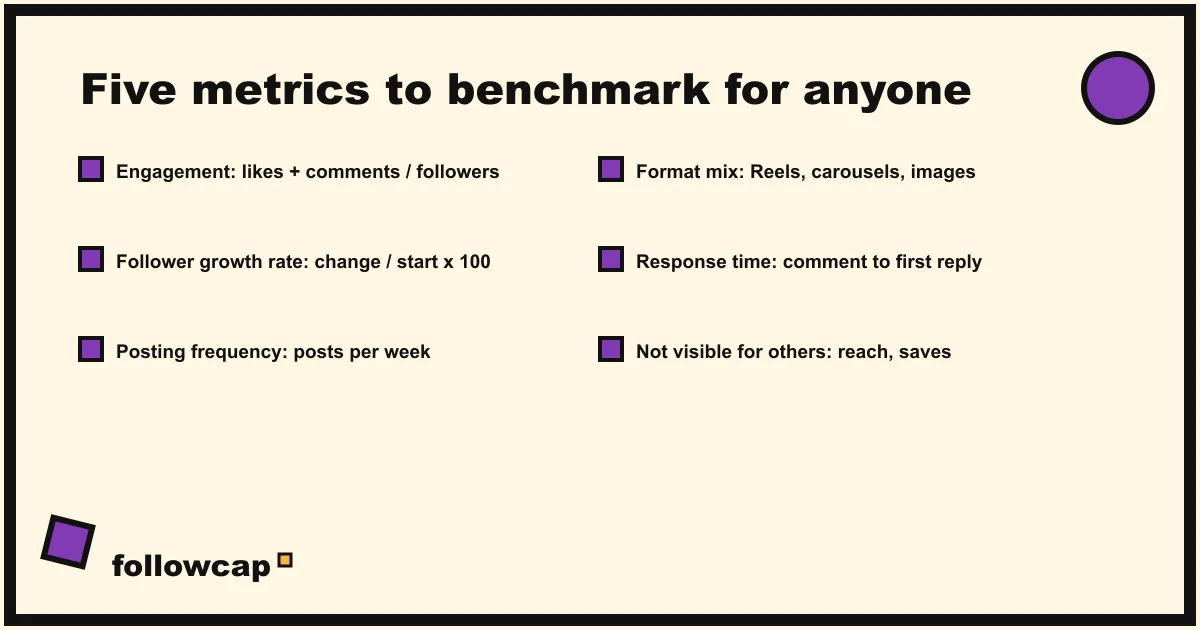
Most guides list a dozen metrics, several of which you cannot see for anyone but yourself. Five are enough, and all five work for a public account you do not own.
| Metric | Formula | Your number | A competitor’s number |
|---|---|---|---|
| Engagement rate per post | (likes + comments) ÷ followers × 100, averaged over the period | Insights, or your own public counts | Their public likes and comments, their follower count |
| Follower growth rate | (end followers − start followers) ÷ start followers × 100 | Insights, Total followers | Their follower count, written down weekly |
| Posting frequency | Posts ÷ weeks in the period, by format | Insights, Content you shared | Counting their grid |
| Format mix | Share of posts that are Reels, carousels or images | Your grid | Their grid |
| Response time | Comment or message to first reply | Business Suite, Messaging tab | Visible reply times under their posts, sampled |
Engagement rate is divided by followers because that is the only denominator you have for other accounts; Instagram engagement rate explains the reach-based alternative for your own account. Follower growth is a rate, not a count: 2,000 new followers is a great month at 20,000 followers and a flat one at 2 million; Instagram follower growth rate has the formulas.
Where the numbers come from: your Insights versus their public profile
For your own account you have everything; for everyone else you have what a visitor sees.
Your own account. Instagram’s help page About Instagram insights describes what a public professional account gets free: an overview with Views, Interactions, New followers and Content you shared, for a timeframe within the past 90 days, plus per-post Views, Viewers, Interactions and Accounts engaged. Insights forgets after 90 days, your sheet does not. If you manage the account through a business portfolio, Meta’s page About Insights in Meta Business Suite on desktop lists a Benchmarking tab that compares your business against others in the same category with a similar organic 28-day reach, and a Messaging tab with your response rate and response time. Check that tab before paying for anything.
Any public account you do not own. You can see each post’s date, format, caption and comments, the like count unless the poster hid it, and the follower count on the day you look. Instagram’s help page Hide or unhide like counts on Instagram posts and reels confirms that an account can hide like and view counts on its own posts; when a competitor does, benchmark on comments and note the gap. You cannot see their reach, saves, shares, Story results, audience demographics or messages; how to see analytics of other Instagram accounts draws the line.
Published benchmarks: the numbers, their year and their source
Always carry the year, the formula and the sample with a published number. Three studies cover Instagram, and they disagree by an order of magnitude for reasons unrelated to the accounts measured.
| Study | Instagram engagement rate | How it is measured |
|---|---|---|
| Socialinsider, 2026 Instagram Organic Benchmarks (2025 data) | 0.48% average per post | Likes plus comments per post, divided by followers, averaged |
| Rival IQ, 2025 Social Media Industry Benchmark Report | 0.36% median per post | All interactions divided by followers, median of 150 companies per industry |
| Hootsuite, average engagement rates by industry (October 2026) | 4.2% average | Engagements divided by followers, per post, best-performing content type only |
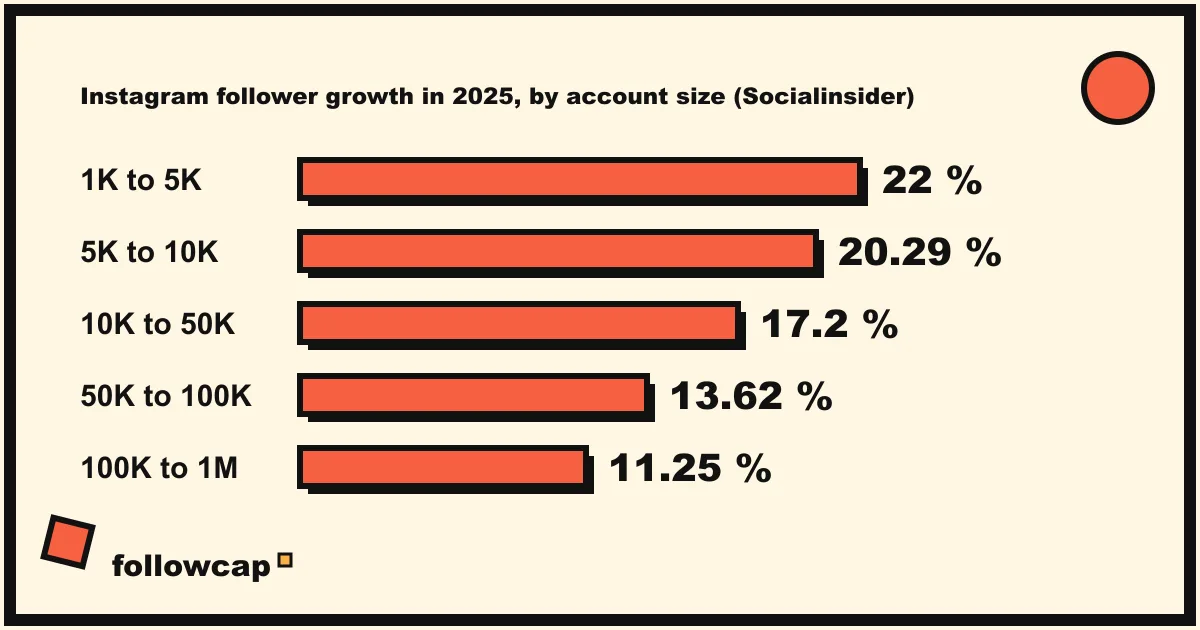
- Socialinsider’s 2026 Instagram Organic Benchmarks, published in February 2026 from 67.5 million organic posts by brand accounts, puts the average engagement rate per post at 0.48% for 2025, down from 0.50% in 2024. Carousels averaged 0.55%, Reels 0.52%, single images 0.37%. Brands posted on average 8 Reels, 5 carousels and 7 images a month. Follower growth for 2025 fell with size: 22.00% for accounts of 1,000 to 5,000 followers, 20.29% for 5,000 to 10,000, 17.20% for 10,000 to 50,000, 13.62% for 50,000 to 100,000 and 11.25% for 100,000 to 1 million.
- Rival IQ’s 2025 report, summarised on its page What is a good engagement rate on Instagram?, gives an all-industry median of 0.36% and a median posting frequency of 4.5 posts per week, from 150 companies in each of 14 industries. Higher Education leads at 2.1%, Sports Teams follow at 1.3%. Medians sit below Socialinsider’s averages because a few viral posts lift an average and leave a median alone.
- Hootsuite’s average engagement rates by industry, dated October 2026, reports 4.2% for Instagram across all industries measured. The page says its figures reflect each platform’s best-performing content type, per post against followers, and states no data period or sample size. Read it as a ceiling for your best format, not as the bar for your account.
A benchmark number is meaningless without its formula: if your sheet averages likes plus comments over followers, Socialinsider’s 0.48% is your reference, and a 4% figure from a different method is not a target you are missing.
How to build a benchmark sheet, step by step
- Choose 3 to 5 accounts. Similar follower band (roughly half to double your size), same audience, public creator or business accounts. Add one aspirational account a band above you, labelled as such.
- Set the period. Four weeks minimum, a quarter for growth rate, the same dates for everyone.
- Log one row per post. Account, date, format, link, likes, comments, and the account’s follower count that day. Log weekly: like counts settle within days, and follower history only exists if you write it down.
- Compute the five metrics per account. Engagement rate per post (average of the rows), follower growth rate, posts per week, format mix as percentages, response time from five comments with visible replies.
- Read the gaps, not the ranking. Three sentences: where you lead, where you lag, and the one thing the leader does that you do not. “They post 3 carousels a week and carousels are their best format; we post none” is a finding; “they beat us” is not.
- Test one change, then re-run the sheet next month. A benchmark that does not change next month’s plan is a report, not a benchmark.
A filled example, with invented accounts, over four weeks:
| Account (example) | Followers | Posts/week | Reels / carousel / image | Avg. eng. rate | Follower growth | Response time |
|---|---|---|---|---|---|---|
| Yours | 18,400 | 2.5 | 60% / 10% / 30% | 0.61% | +1.8% | 9 h |
| Rival A | 22,100 | 4.0 | 50% / 40% / 10% | 0.74% | +3.1% | 3 h |
| Rival B | 15,900 | 1.5 | 20% / 20% / 60% | 0.39% | +0.6% | 2 days |
| Aspirational C | 61,000 | 5.0 | 70% / 30% / 0% | 0.52% | +2.4% | 1 day |
Rival A posts more, leans on carousels, replies fast and grows fastest; the aspirational account has a lower rate, as larger accounts do. Next month’s test: two carousels a week, replies within the working day.
Keeping the sheet filled when you have ten accounts
The sheet is free, and its only cost is time: our estimate is about 15 minutes per account per week, so ten accounts is about 2 hours 30, which is why most sheets die in month two. Two ways to cut that: an analytics tool with competitor profiles, compared in best Instagram analytics tools, or a weekly recap by email.
Followcap is our product, so read this as the maker’s description. You type the usernames of public Instagram creator or business accounts, with no Instagram login or password, and every Sunday you get one email with a 30-second summary of the week, the three posts not to miss, the best three posts of each account with a short recap, their day and their link, and “what you can apply this week”. Three accounts are free with no card. Premium (€9 a month, 10 accounts) opens with “this week in numbers” and adds the weekly numbers per account (posts, likes, comments, best post, follower growth) and an archive page that keeps every post of every week. Its limits: weekly, not real time; public creator and business accounts only; likes, comments, posts and follower counts only, so no reach, saves, views, Stories, mentions or audience data; paid plans are paid after the 7-day trial, with a 30-day money-back.
Common benchmarking mistakes
- Comparing reach you cannot see. Reach, views and saves exist only in an account’s own Insights; any “competitor reach” figure is modelled.
- Mixing formulas or platforms. A rate by reach against a rate by followers, an average against a median, or Instagram against TikTok, produces a gap that is pure arithmetic. One formula, one platform, written at the top of the sheet.
- Tiny samples. One week, or one post, tells you about that week. Four weeks minimum, a quarter for growth.
- Ignoring size. Growth rate falls as accounts grow, in every study. Compare within a band.
FAQ
What is social media benchmarking?
Measuring your performance against a reference point with the same metrics and formulas on both sides: your own past results, competitors or reference accounts, or published industry studies. The output is a short list of gaps and one change to test.
What is a good engagement rate on Instagram?
It depends on the formula and the size of the account. With likes plus comments divided by followers, Socialinsider’s 2025 data averages 0.48% per post and Rival IQ’s 2025 median is 0.36%; a small account at 1% to 2% is doing well, a large account below 0.5% is normal. A study reporting 4% or more is using a different method.
How often should you benchmark?
Log weekly, compare monthly, review the competitor set quarterly. Weekly logging keeps the follower history, monthly comparison gives four weeks of posts per account.
Which metrics should I benchmark against competitors?
The five you can measure for everyone: engagement rate per post, follower growth rate, posting frequency, format mix and response time. Keep your own reach, saves and shares in a separate column, never compared with numbers nobody can see.
What is the difference between benchmarking and competitor analysis?
Benchmarking is the quantitative part: the same few metrics for every account over the same weeks. Competitor analysis is wider, covering positioning, content themes, hooks, offers and campaigns.
Related reading
- How to See Instagram Insights (and What Each Number Means)
- Instagram Audit Checklist: 25 Points to Review Your Account (2026)
- Instagram Profile Analyzer: What It Shows for Any Public Account
The bottom line
Social media benchmarking works when the formula is the same on both sides, the sample is at least four weeks, and the accounts are the same size. Five metrics cover it: engagement rate per post, follower growth rate, posting frequency, format mix and response time. Use published studies for context with their year and method attached, and fill the competitor rows by hand or with a weekly recap such as Followcap, which we make and which only ever sees public posts, likes, comments and follower counts. Then read the gaps and test one thing.