Instagram Profile Analyzer: What It Shows for Any Public Account
What an Instagram profile analyzer shows for a public account, what no tool can see, three free analyzers from reputable sites, and a 10-minute manual method.
 Andrea Marino11 min read
An Instagram profile analyzer takes a public username and turns the profile’s visible data into numbers: followers, following, post count, posting rhythm, average likes and comments, engagement rate and, if it has been watching for a while, follower growth. It cannot see reach, saves, views, demographics or Stories, because Instagram shows those only to the account’s owner.
Quick answer: for a one-off check of a public creator or brand, run the username through a free calculator from an established influencer-marketing company (HypeAuditor, Modash or Phlanx), then spend ten minutes on the profile itself to confirm the numbers and read the comments. For change over time, log the same public figures weekly. Skip any “analyzer” that asks for your Instagram password or promises private-account or viewer data.
What a profile analyzer can and cannot show
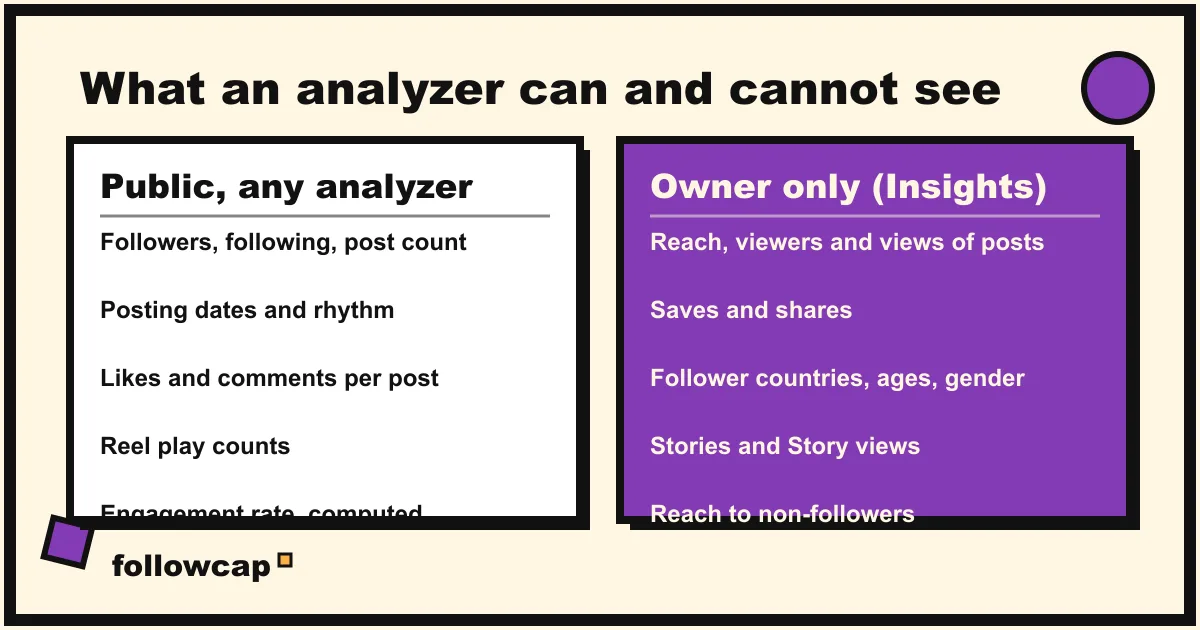
Every honest analyzer works from the same raw material: what anyone can see on a public profile in a browser without logging in. That sets a hard ceiling on what it can report.
| Data point | Visible on a public profile? | What an analyzer does with it |
|---|---|---|
| Followers, following, post count | Yes, at the top of the profile | Ratios, and growth if it stores the count over time |
| Dates of posts | Yes, on each post | Posts per week, gaps, most used days |
| Likes per post | Usually; the poster can hide the count | Average likes, best post |
| Comments per post | Yes | Average comments, comment quality if it reads them |
| Reel play counts | Yes, printed on the Reel | Average plays |
| Engagement rate | Derived | (likes + comments) ÷ followers × 100, averaged over recent posts |
| Reach, views of photo posts, saves, shares | No | Nothing; any figure here is an estimate |
| Audience countries, ages, gender | No | A guess from the followers it can sample, at best |
| Stories, Story views, Lives | No | Nothing once the Story expires |
| Account Status, reach to non-followers | No | Nothing |
The lower half of that table lives in Instagram Insights. Instagram’s own description of what Insights contain lists Views, Viewers with top countries, cities, age ranges and gender, Interactions (likes, comments, saves and shares), Accounts engaged and Total followers with growth and active times, all for the account’s owner and all within a 90-day window. No third party has that feed for someone else’s account. When an analyzer prints “estimated reach” or “audience: 62% women” for a profile that is not yours, it is modelling, not reporting.
Two more limits worth knowing. Instagram lets any poster hide like and view counts on their own posts, so an analyzer’s “average likes” for such an account is either blank or borrowed from a cached crawl. And a private account shows nothing beyond its name, bio, and the three counts, so no analyzer can analyse it; the ones that claim to are selling the claim, not the data.
Three free analyzers from reputable sites (verified, late 2026)
Dozens of pages rank for “free Instagram profile analyzer”. Most are thin tools built by growth-hacking or follower-selling sites, and some are fronts for “viewer” apps. The three below belong to established influencer-marketing platforms whose real business is the paid product; the free checker is their lead magnet, so it tends to stay online. All three work on public accounts only and need no login to Instagram.
| Tool | What it shows for a username | Sees other accounts? | From price | Best for |
|---|---|---|---|---|
| HypeAuditor Instagram Audit | Follower count, engagement rate and an Audience Quality Score; the fuller report adds category, ranks, average likes and comments per post, and followers gained or lost in the past 4 weeks | Yes, any public account | Free tool; the platform is paid | Vetting a creator’s follower quality before a deal |
| Modash Engagement Rate Calculator | Engagement rate, average likes, average comments, average Reel plays and top Reels, with a median benchmark; audience location and gender sit behind a free trial | Yes, any public account | Free, no sign-up needed | A quick, well-defined engagement number |
| Phlanx Engagement Calculator | Followers, engagement rate and average interactions per post split into likes and comments, with Phlanx’s own 2026 averages by follower tier underneath | Yes, any public account | Free tool; paid plans on the site | A second opinion on the same account |
Read the numbers with their method in mind. Modash states that it divides median likes over the last two months by followers, using the median rather than the mean, which flattens the effect of one viral Reel. Phlanx’s tier averages (6.08% for 1K to 5K followers down to 2.66% above 1M, by its own count) describe influencer accounts and sit far above the brand-account averages in the benchmark studies, so a brand that scores 0.5% on Phlanx’s calculator is not failing; it is being compared with the wrong crowd. HypeAuditor’s Audience Quality Score is proprietary, so treat it as a flag to investigate, not a verdict. How to spot fake followers on Instagram covers what to check when that flag turns red.
Why the top-ranking “analyzer” sites are a bad trade
Search this query and the first page is mostly tools you have never heard of, promising 15 metrics in 30 seconds, audience demographics and sometimes “private profile” access. Three problems, in order of cost.
The first is your account. Any analyzer that asks you to log in with Instagram, or install an extension that reads your session, holds your access token. Instagram’s Terms of Use say you can’t “access or collect information in unauthorized ways”, and the account that gets flagged for it is the one that logged in, which is yours, not the tool’s.
The second is the data. Tools without a login scrape public pages, which break every time Instagram changes its markup, so the follower history you were building vanishes with the site. The demographics, reach and “fake follower %” they print come from a sample of a few hundred followers and a model, which is why two such tools give different answers for the same account on the same day.
The third is what they are really for. Several of the pages ranking for this query sit on domains that also sell followers, likes or a “private Instagram viewer”. An analyzer that lives next to a follower shop is a funnel. Can you see who views your Instagram profile explains why the viewer promise in particular is always false.
How to do a 10-minute manual profile analysis
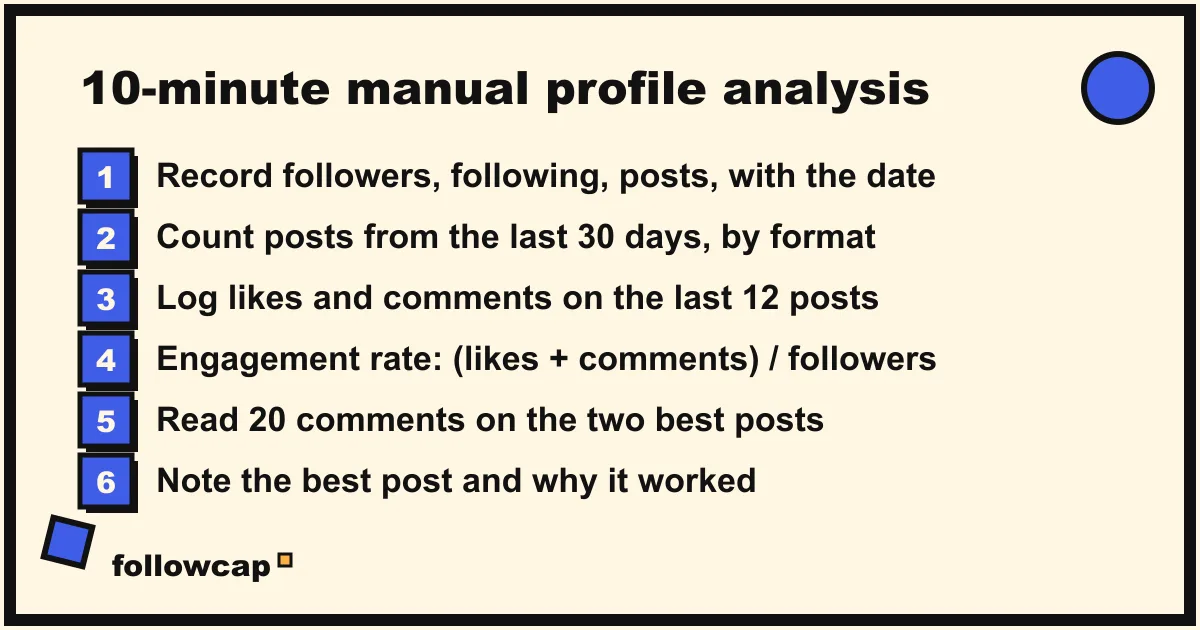
No tool reads a profile as well as you can with a browser, a notes file and ten minutes. Open the profile on instagram.com, then work down this list.
- Record the three counts. Followers, following and posts, with today’s date. The following-to-follower ratio is your first signal: a 40,000-follower account that follows 7,000 people is usually trading follows, a creator following 300 is usually not.
- Count the posts from the last 30 days. Scroll until the dates pass a month ago. Note the number, the mix (Reels, carousels, single images) and the longest gap. Socialinsider’s 2026 benchmarks put the average brand account at 8 Reels, 5 carousels and 7 images a month in 2025, so a profile posting twice a week is below average and one posting daily is well above it.
- Log likes and comments on the last 12 posts. Skip the two most recent, which are still collecting. Write down each post’s likes and comments, then average them. If like counts are hidden, use comments and Reel plays only and say so in your notes.
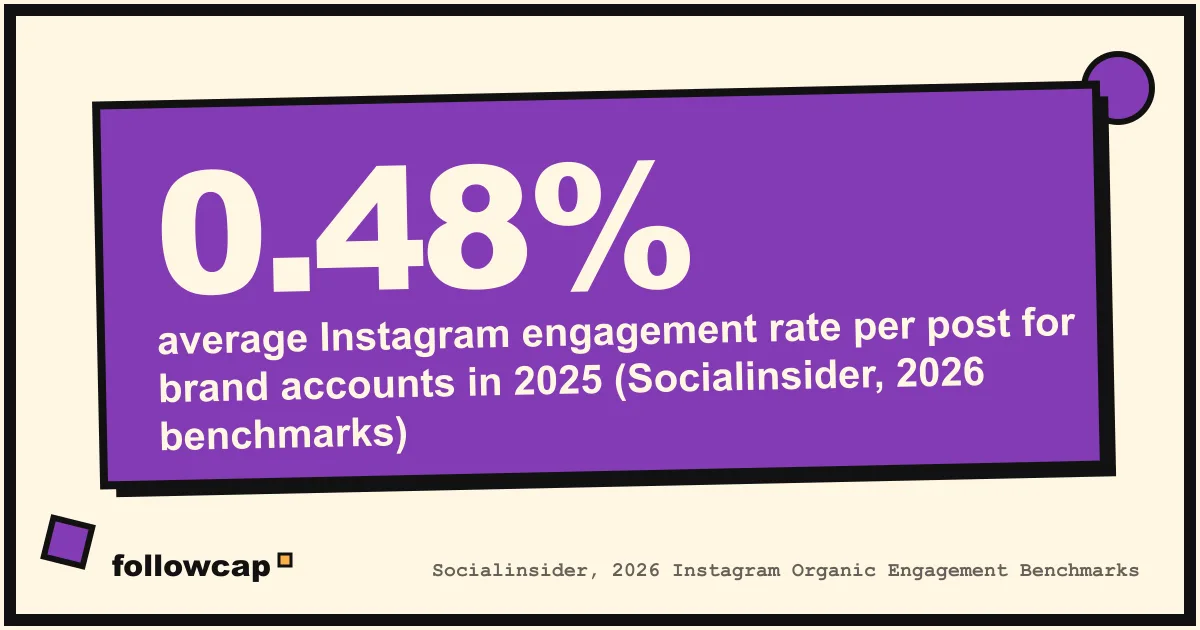
- Compute the engagement rate. (Average likes + average comments) ÷ followers × 100. Instagram engagement rate explains the variants; the one above matches the formula Socialinsider uses, so you can compare your result with its 2026 Instagram benchmarks: an average of 0.48% per post by followers across 67.5 million posts from 579,000 brand accounts with 1,000 to 1 million followers in 2025, with carousels at 0.55%, Reels at 0.52% and images at 0.37%.
- Read 20 comments on the two best posts. Real audiences write specific things (“the second slide is exactly what my team argues about”). Bought engagement writes “Nice!”, emoji strings and the same sentence under five posts.
- Note the best post and why. The one with the most comments relative to its likes is usually the one that struck a nerve, and it tells you more about the account’s audience than the follower count does.
Ten minutes gives you a snapshot no tool matches, because you have read the comments. For a fuller sheet, the Instagram audit checklist extends this to bio, highlights and grid.
Reading the numbers: normal, good and suspicious
A single engagement rate means little without the account’s size and type. Socialinsider’s study shows the rate falls as accounts grow, and its follower growth table shows the same shape: in 2025, brand accounts with 1,000 to 5,000 followers grew 22% over the year on average, those with 10,000 to 50,000 grew 17.2%, and those with 100,000 to 1 million grew 11.25%. So a 300,000-follower account adding 1% a month is on trend, and a 3,000-follower account adding 1% a month is slow.
Suspicious patterns are easier to name than good ones:
- Engagement far below the tier. A 100,000-follower account averaging 120 likes (0.12%) with a healthy posting rhythm either has a dead or bought audience or hides nothing but its real numbers.
- Likes without comments. 4,000 likes and 6 comments on every post, regardless of topic, is the signature of purchased likes.
- A step in the follower count. Real growth is a slope with a few bumps from viral posts; bought followers are a vertical step, often followed by a slow slide as Instagram removes the accounts.
A profile analyzer that only shows today’s numbers cannot see the step or the slide. That is the main reason to track rather than check.
Tracking change over time, once a week
The most useful thing you can learn about any public account is its direction: is it posting more, is the engagement per post rising or falling, which post won this week, how many followers did it gain. None of that is visible in a snapshot, and Instagram keeps no public history, so you either log it yourself or let a service do it.
The manual version is a sheet with one row per week per account: date, followers, posts this week, total likes, total comments, best post and its link. Fifteen minutes a week for five accounts, and after two months you have a growth chart no free analyzer offers. Instagram follower growth tracker is the detailed template.
Followcap is our product, so read this as the maker’s description. You type the usernames of public Instagram creator or business accounts, with no Instagram login or password, and every Sunday one email arrives with a 30-second summary, the three posts not to miss, a two to three line recap of the best posts from each account with their links, and “what you can apply this week”. Three accounts are free with no card. Premium (€9 a month, 10 accounts) adds the weekly numbers per account (posts, likes, comments, best post, follower growth) and a personal archive page where the history builds up; Business Pro (€29 a month, 50 accounts, 3 team users) adds a monitoring dashboard with alerts, CSV export and a “you vs your niche” view. Its limits are the same as every honest analyzer’s, and then some: it is weekly, not real time; it covers public creator and business accounts only; it sees public posts, likes, comments and follower counts, so no reach, saves, views, Stories, mentions, hashtags or audience data; and the paid plans are paid after the 7-day trial, with a 30-day money-back.
FAQ
Is there a free Instagram profile analyzer that works?
Yes. HypeAuditor’s Instagram Audit, Modash’s Engagement Rate Calculator and Phlanx’s Engagement Calculator each return followers, engagement rate and average likes and comments for any public account, free and without an Instagram login. They disagree with each other because they use different post windows and averaging methods, so pick one and use it consistently.
Can an analyzer work on a private Instagram account?
No. A private profile shows only its name, bio, profile picture and the follower, following and post counts to non-followers. Any tool that claims to analyse posts, likes or “viewers” of a private account is either guessing or lying.
Does the account owner know when I analyse their profile?
No. Reading a public profile in a browser or through a calculator leaves no trace the owner can see. Instagram does not show profile visitors to anyone, and the tools that promise “see who viewed your profile” cannot deliver it.
How is a profile analyzer different from Instagram Insights?
Insights is Instagram’s own dashboard for your account, with views, viewers, saves, shares, demographics and follower growth for the past 90 days. An analyzer works from the outside on any public account and sees only what the profile shows: counts, posts, likes, comments and Reel plays. Insights is deeper; an analyzer is wider. How to see analytics of other Instagram accounts walks through the gap in detail.
What is a good engagement rate for an Instagram profile?
It depends on size and type. Socialinsider’s 2026 benchmarks put the 2025 average for brand accounts at 0.48% per post by followers, with smaller accounts higher and large ones lower. Creator-focused calculators such as Phlanx report tier averages several times that, because creator audiences engage more than brand followers.
Related reading
- How to Monitor an Instagram Account: Yours, a Brand’s or a Creator’s
- Instagram Follower Count History: How to See It (Yours and Any Account)
- The Best Instagram Analytics Tools in 2026 (Yours and Others’)
The bottom line
An Instagram profile analyzer can tell you everything a public profile shows and nothing it hides: counts, rhythm, likes, comments, Reel plays and an engagement rate, never reach, saves, demographics or Stories. For a one-off check, the free calculators from HypeAuditor, Modash and Phlanx are the ones worth trusting, followed by ten minutes of your own reading. For the thing that matters most, how an account changes, log the public numbers weekly yourself or let a weekly recap such as Followcap, which we make, do the logging for public creator and business accounts.